Advanced Market Research Analytics
Terapage Reports and Data Analysis Feature
Terapage’s Reports and Analysis feature is a cornerstone of our market research platform, offering researchers an intuitive and powerful way to interpret data and communicate findings effectively. Designed to meet the diverse needs of modern research, this feature transforms complex data into clear, actionable insights through customisable reports, visualisations, and in-depth analysis tools. With enhanced capabilities that go beyond traditional methods, Terapage equips researchers with everything they need to make informed decisions and drive impactful outcomes.
Get Started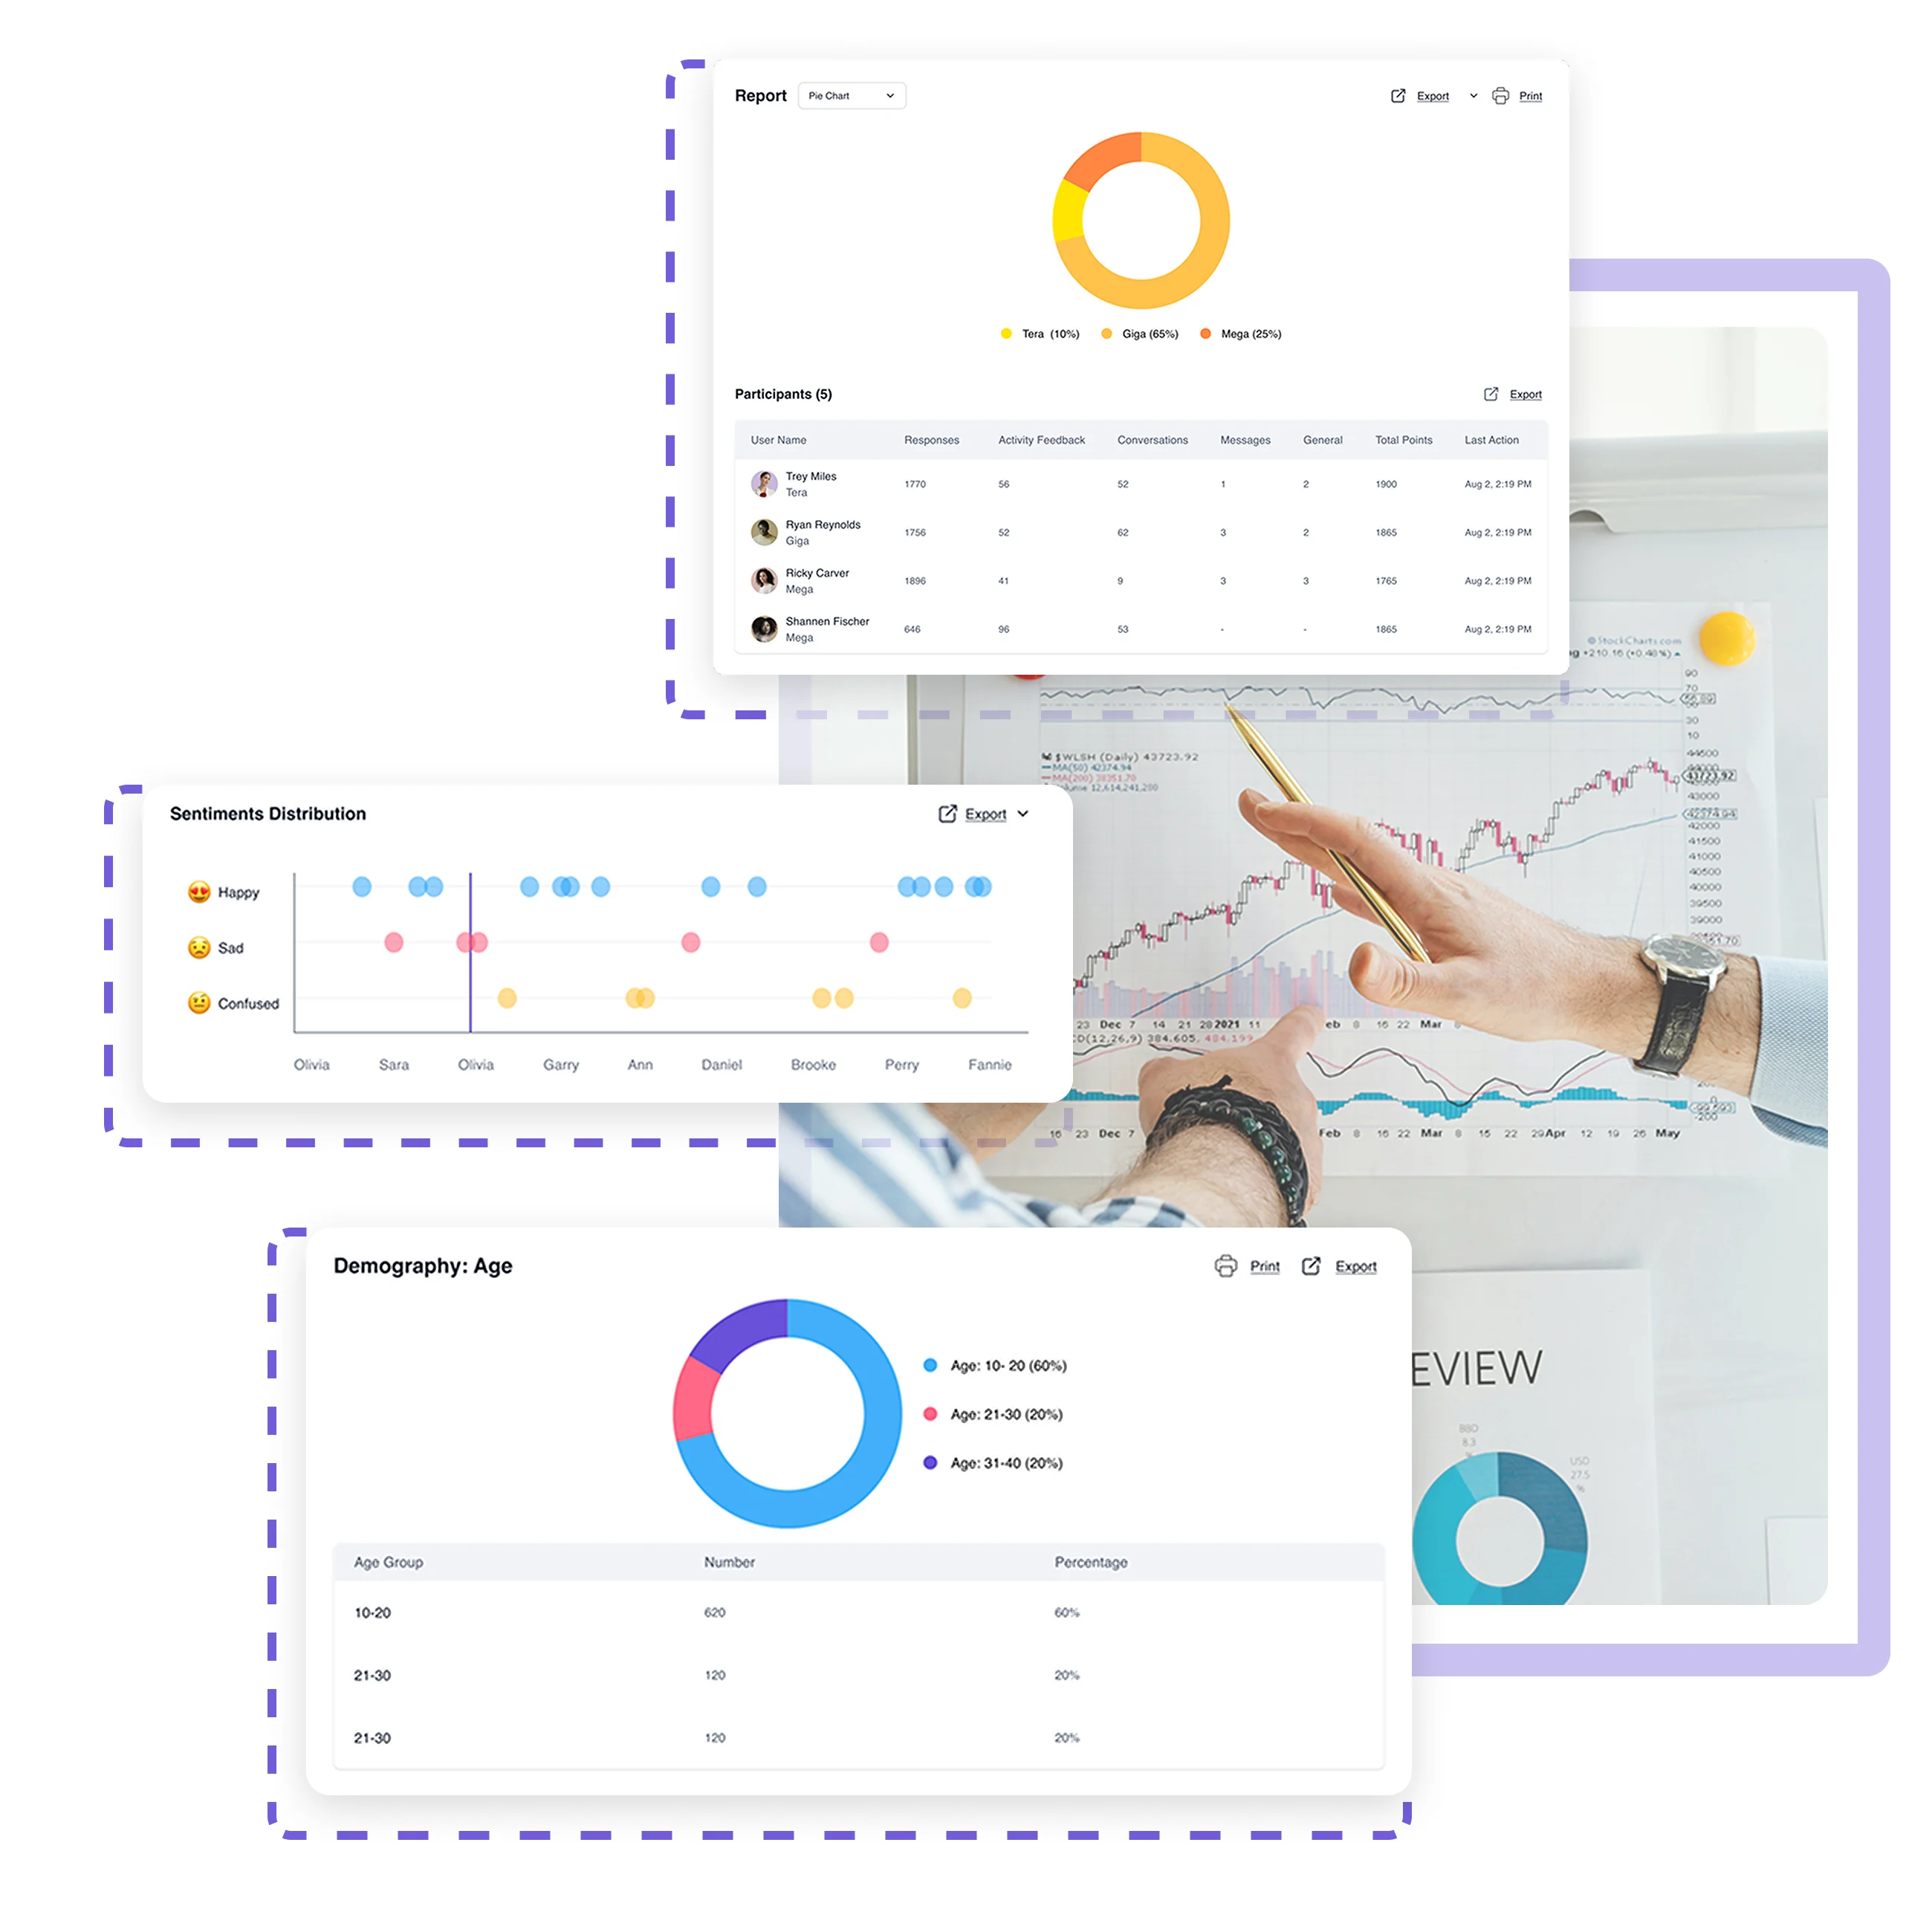
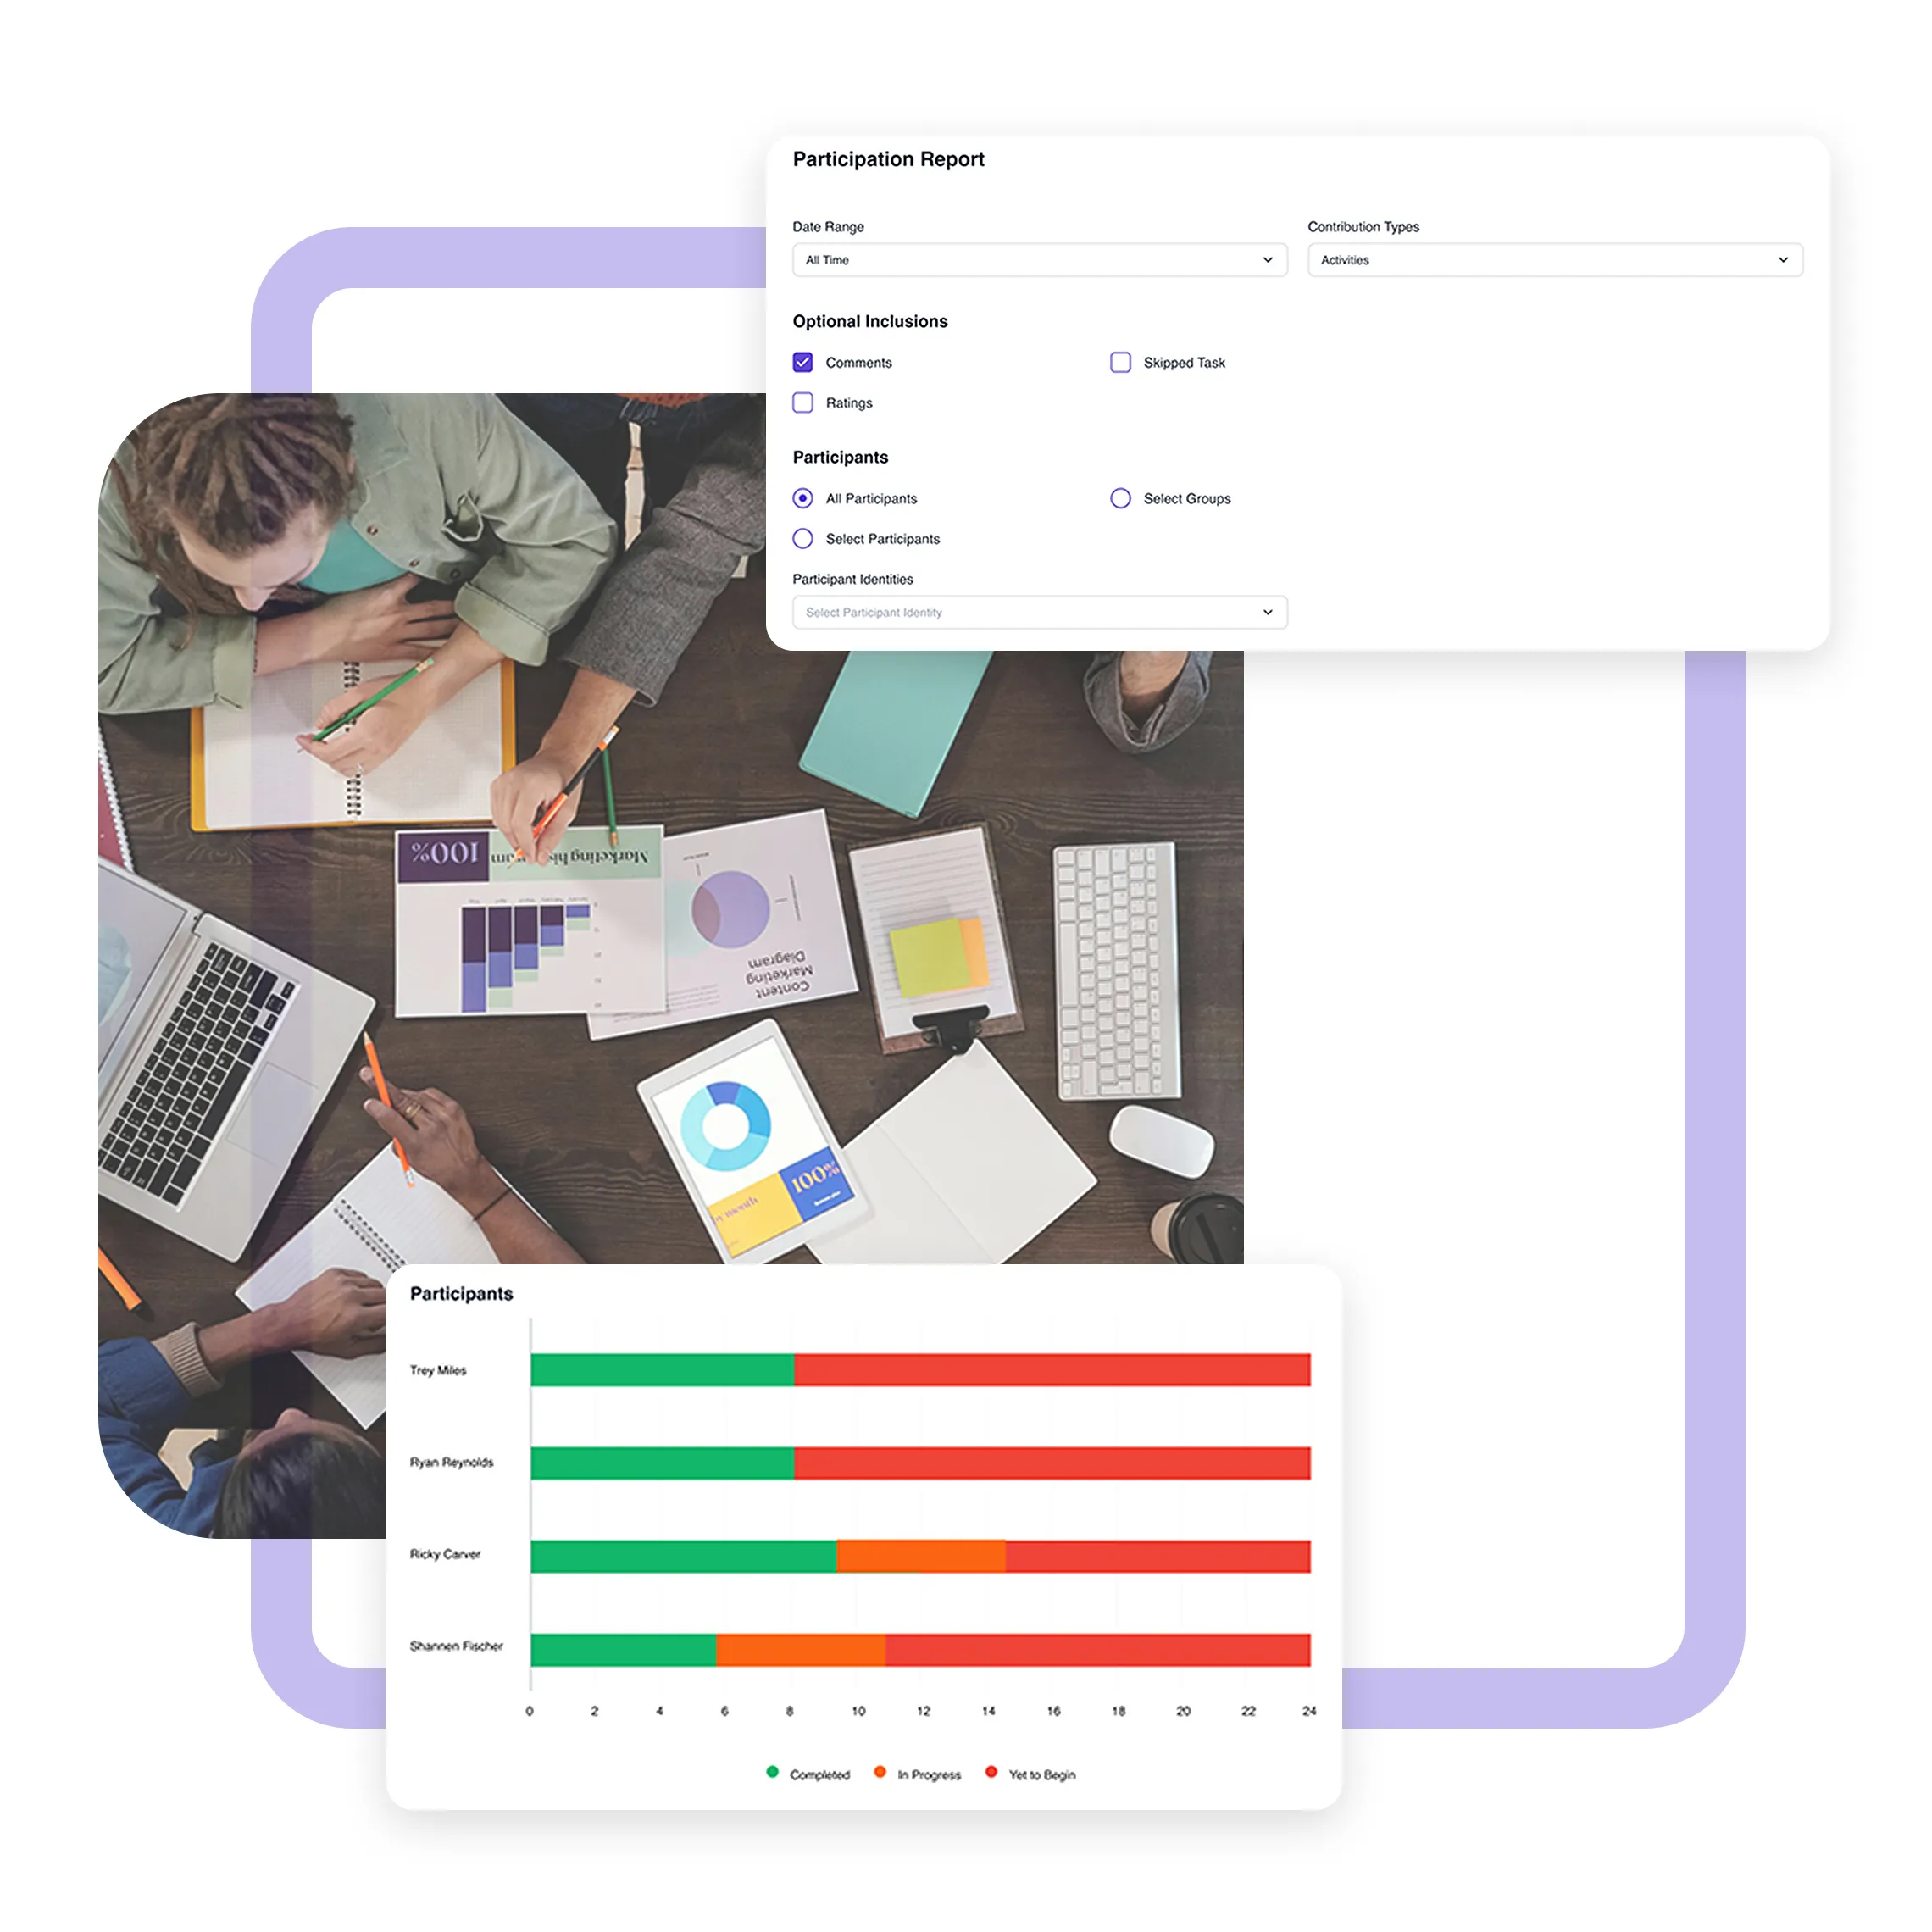
Custom Research Reports for Tailored Insights
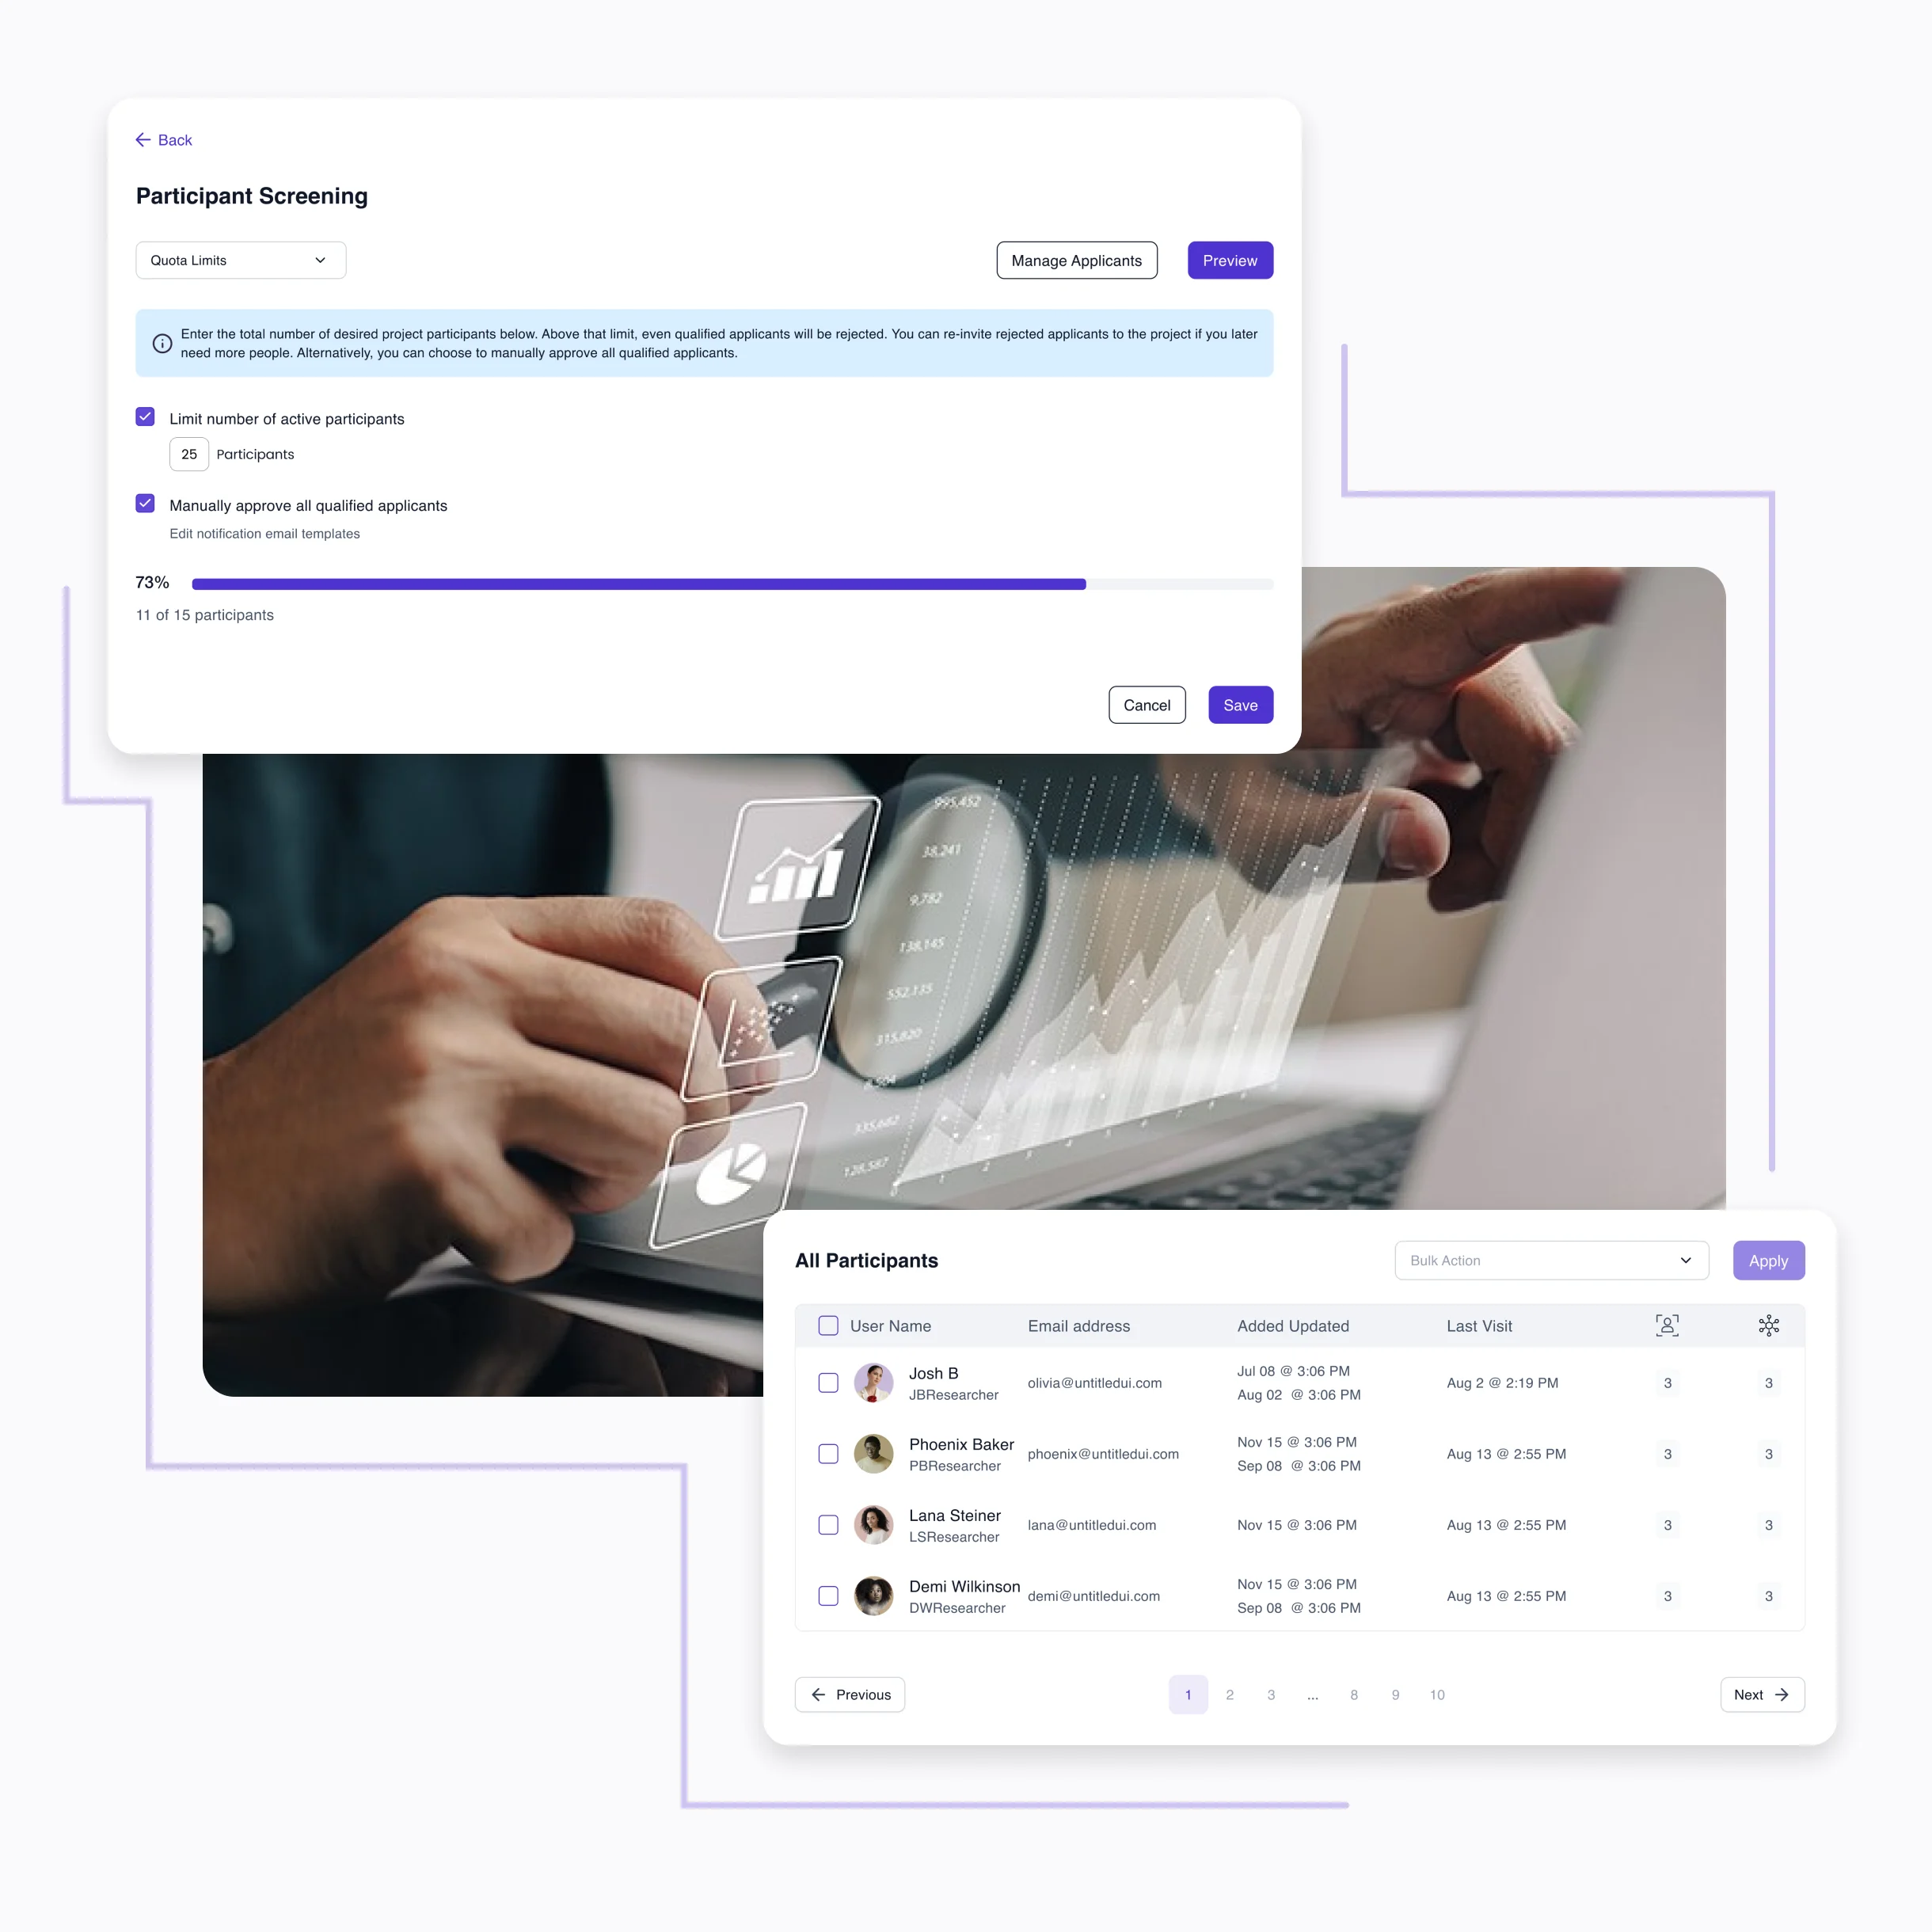
The Reports and Analysis feature allows researchers to create fully customisable reports that align with their study objectives and audience needs. From high-level executive summaries to detailed participant-level analyses, reports can be tailored to highlight the most relevant insights. Researchers can organise data by activity, segment, or individual responses, ensuring that every report delivers precise and meaningful information.
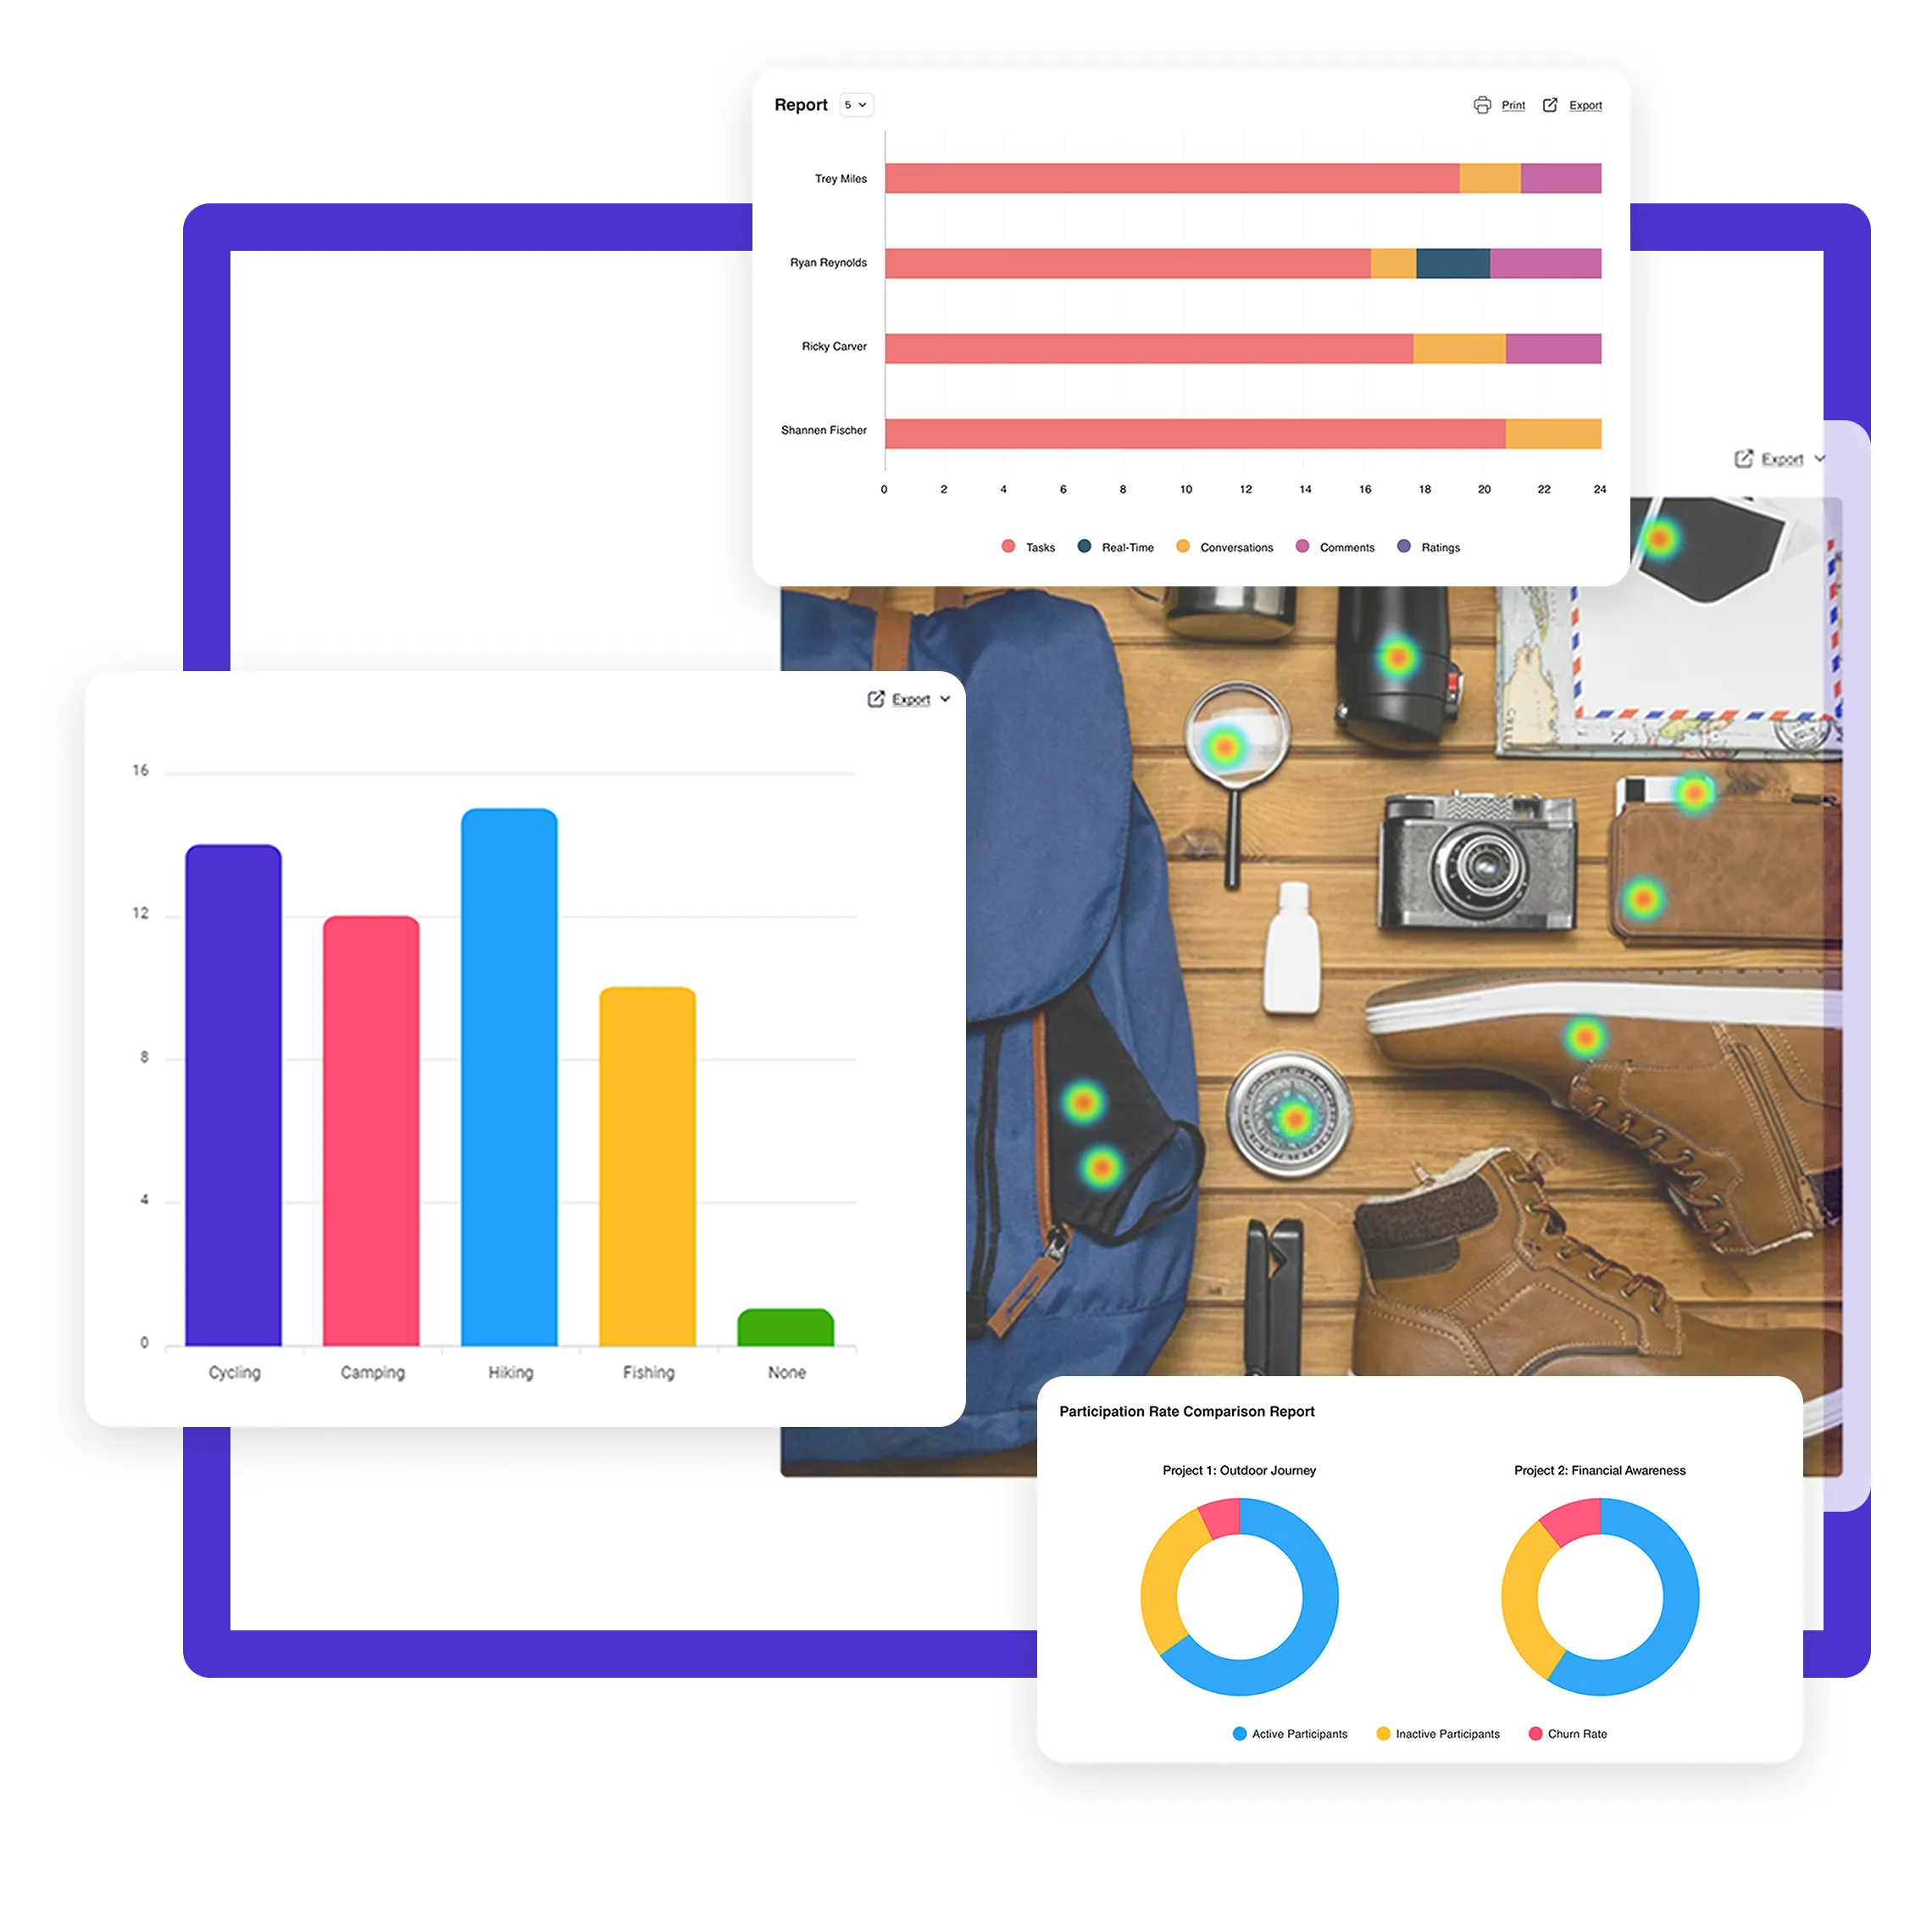
See Use CasesAdvanced Data Visualisation and Charting Tools
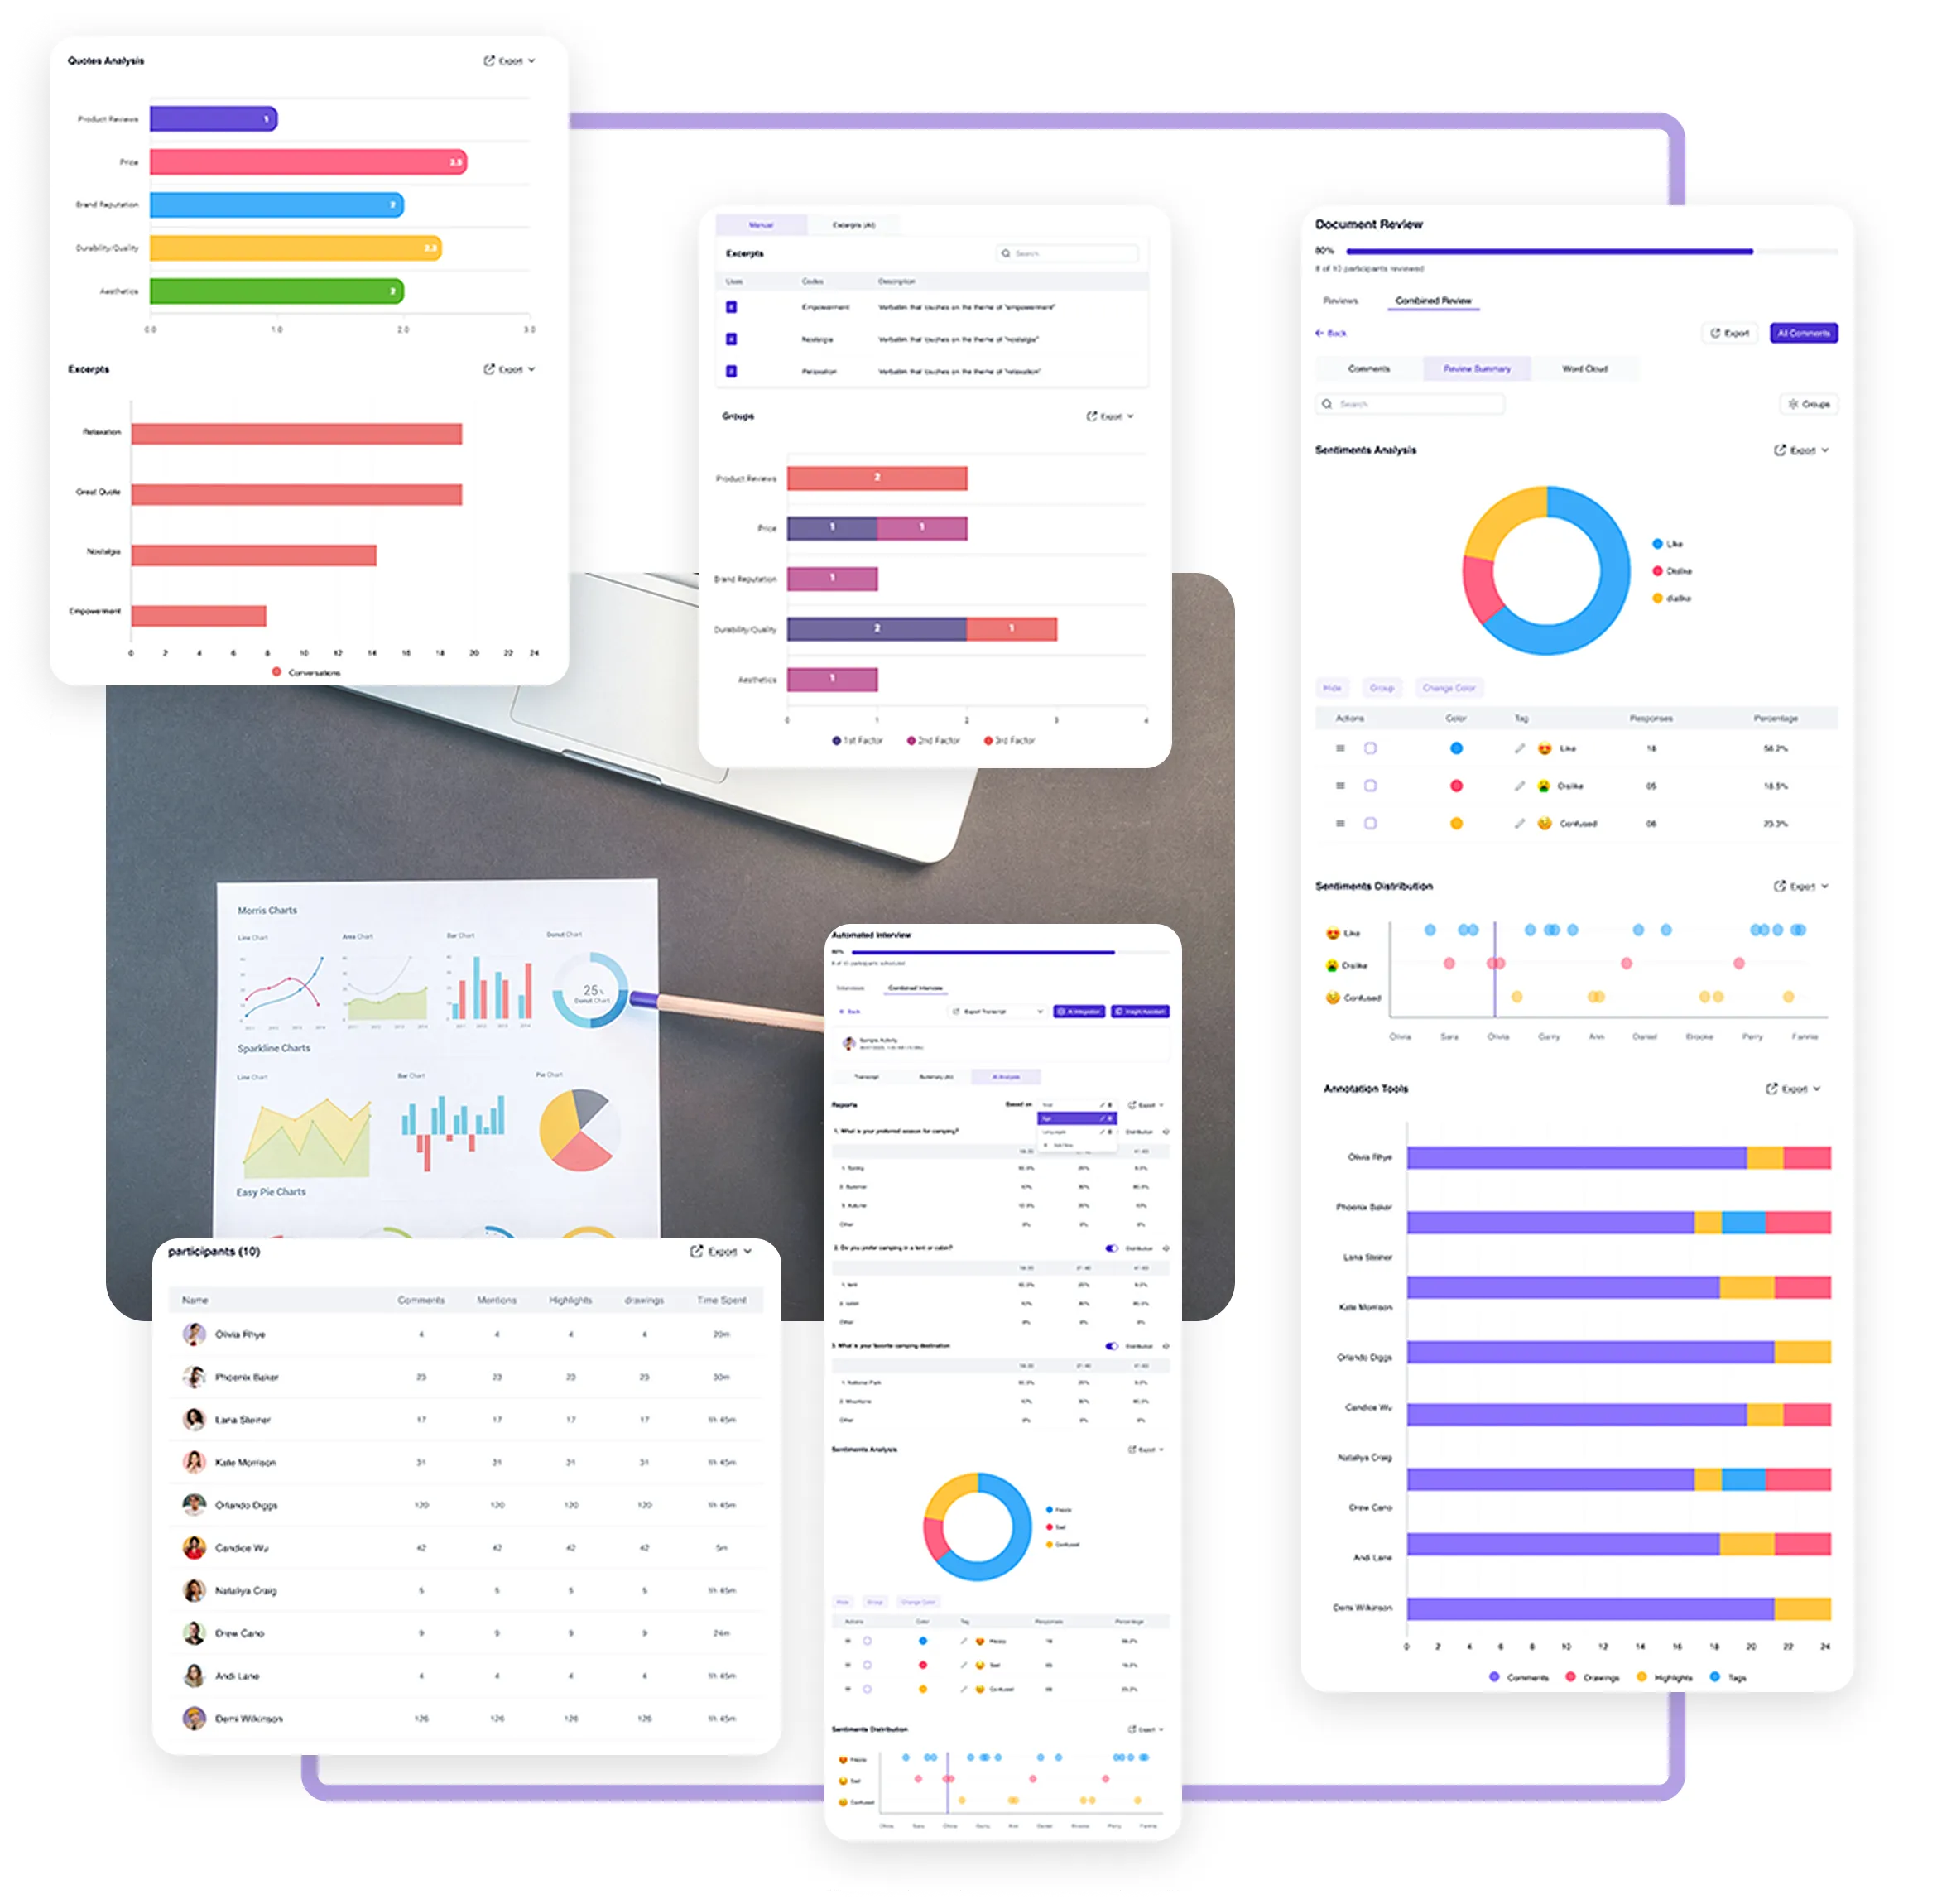
Visualising data is key to understanding and presenting research findings. Terapage provides a wide range of data visualisation options, including bar charts, pie charts, line graphs, heatmaps, and word clouds, all of which can be customised to suit the specific needs of your project. These visualisations bring clarity to complex datasets, making it easier to identify patterns and trends. Interactive elements allow researchers to drill down into specific data points for deeper analysis.

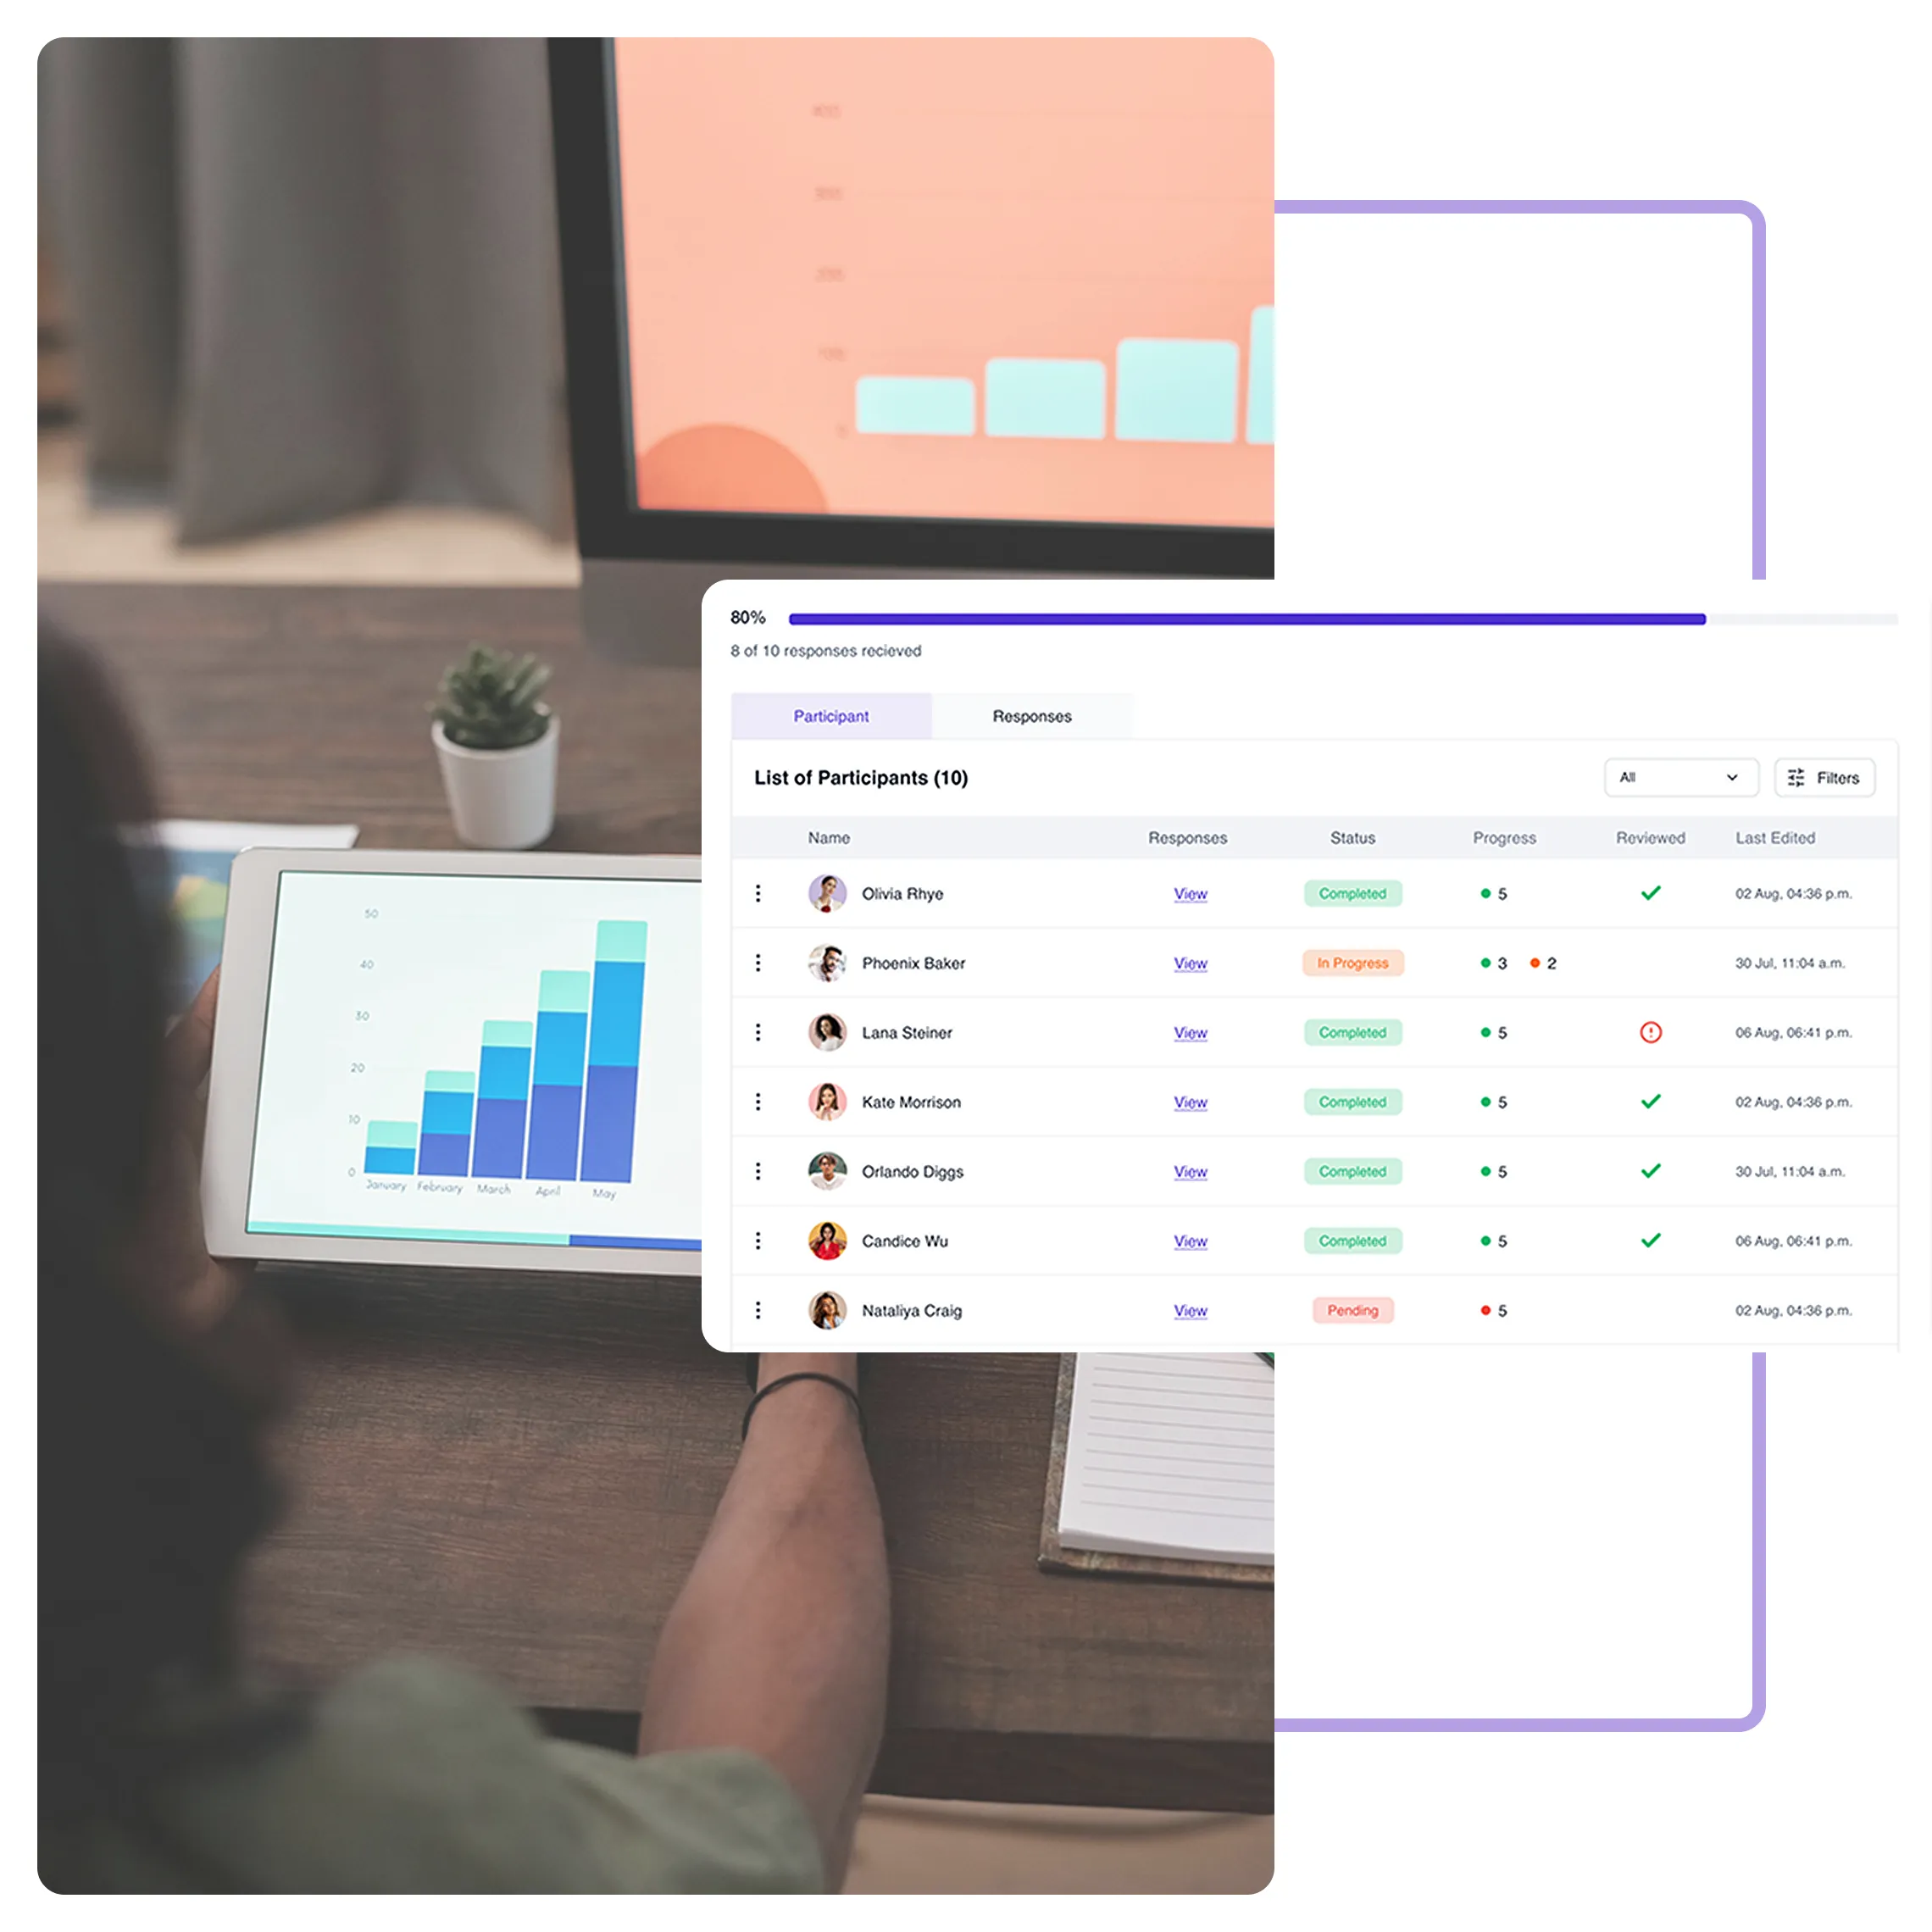
Real-Time Dashboards for Continuous Research Monitoring
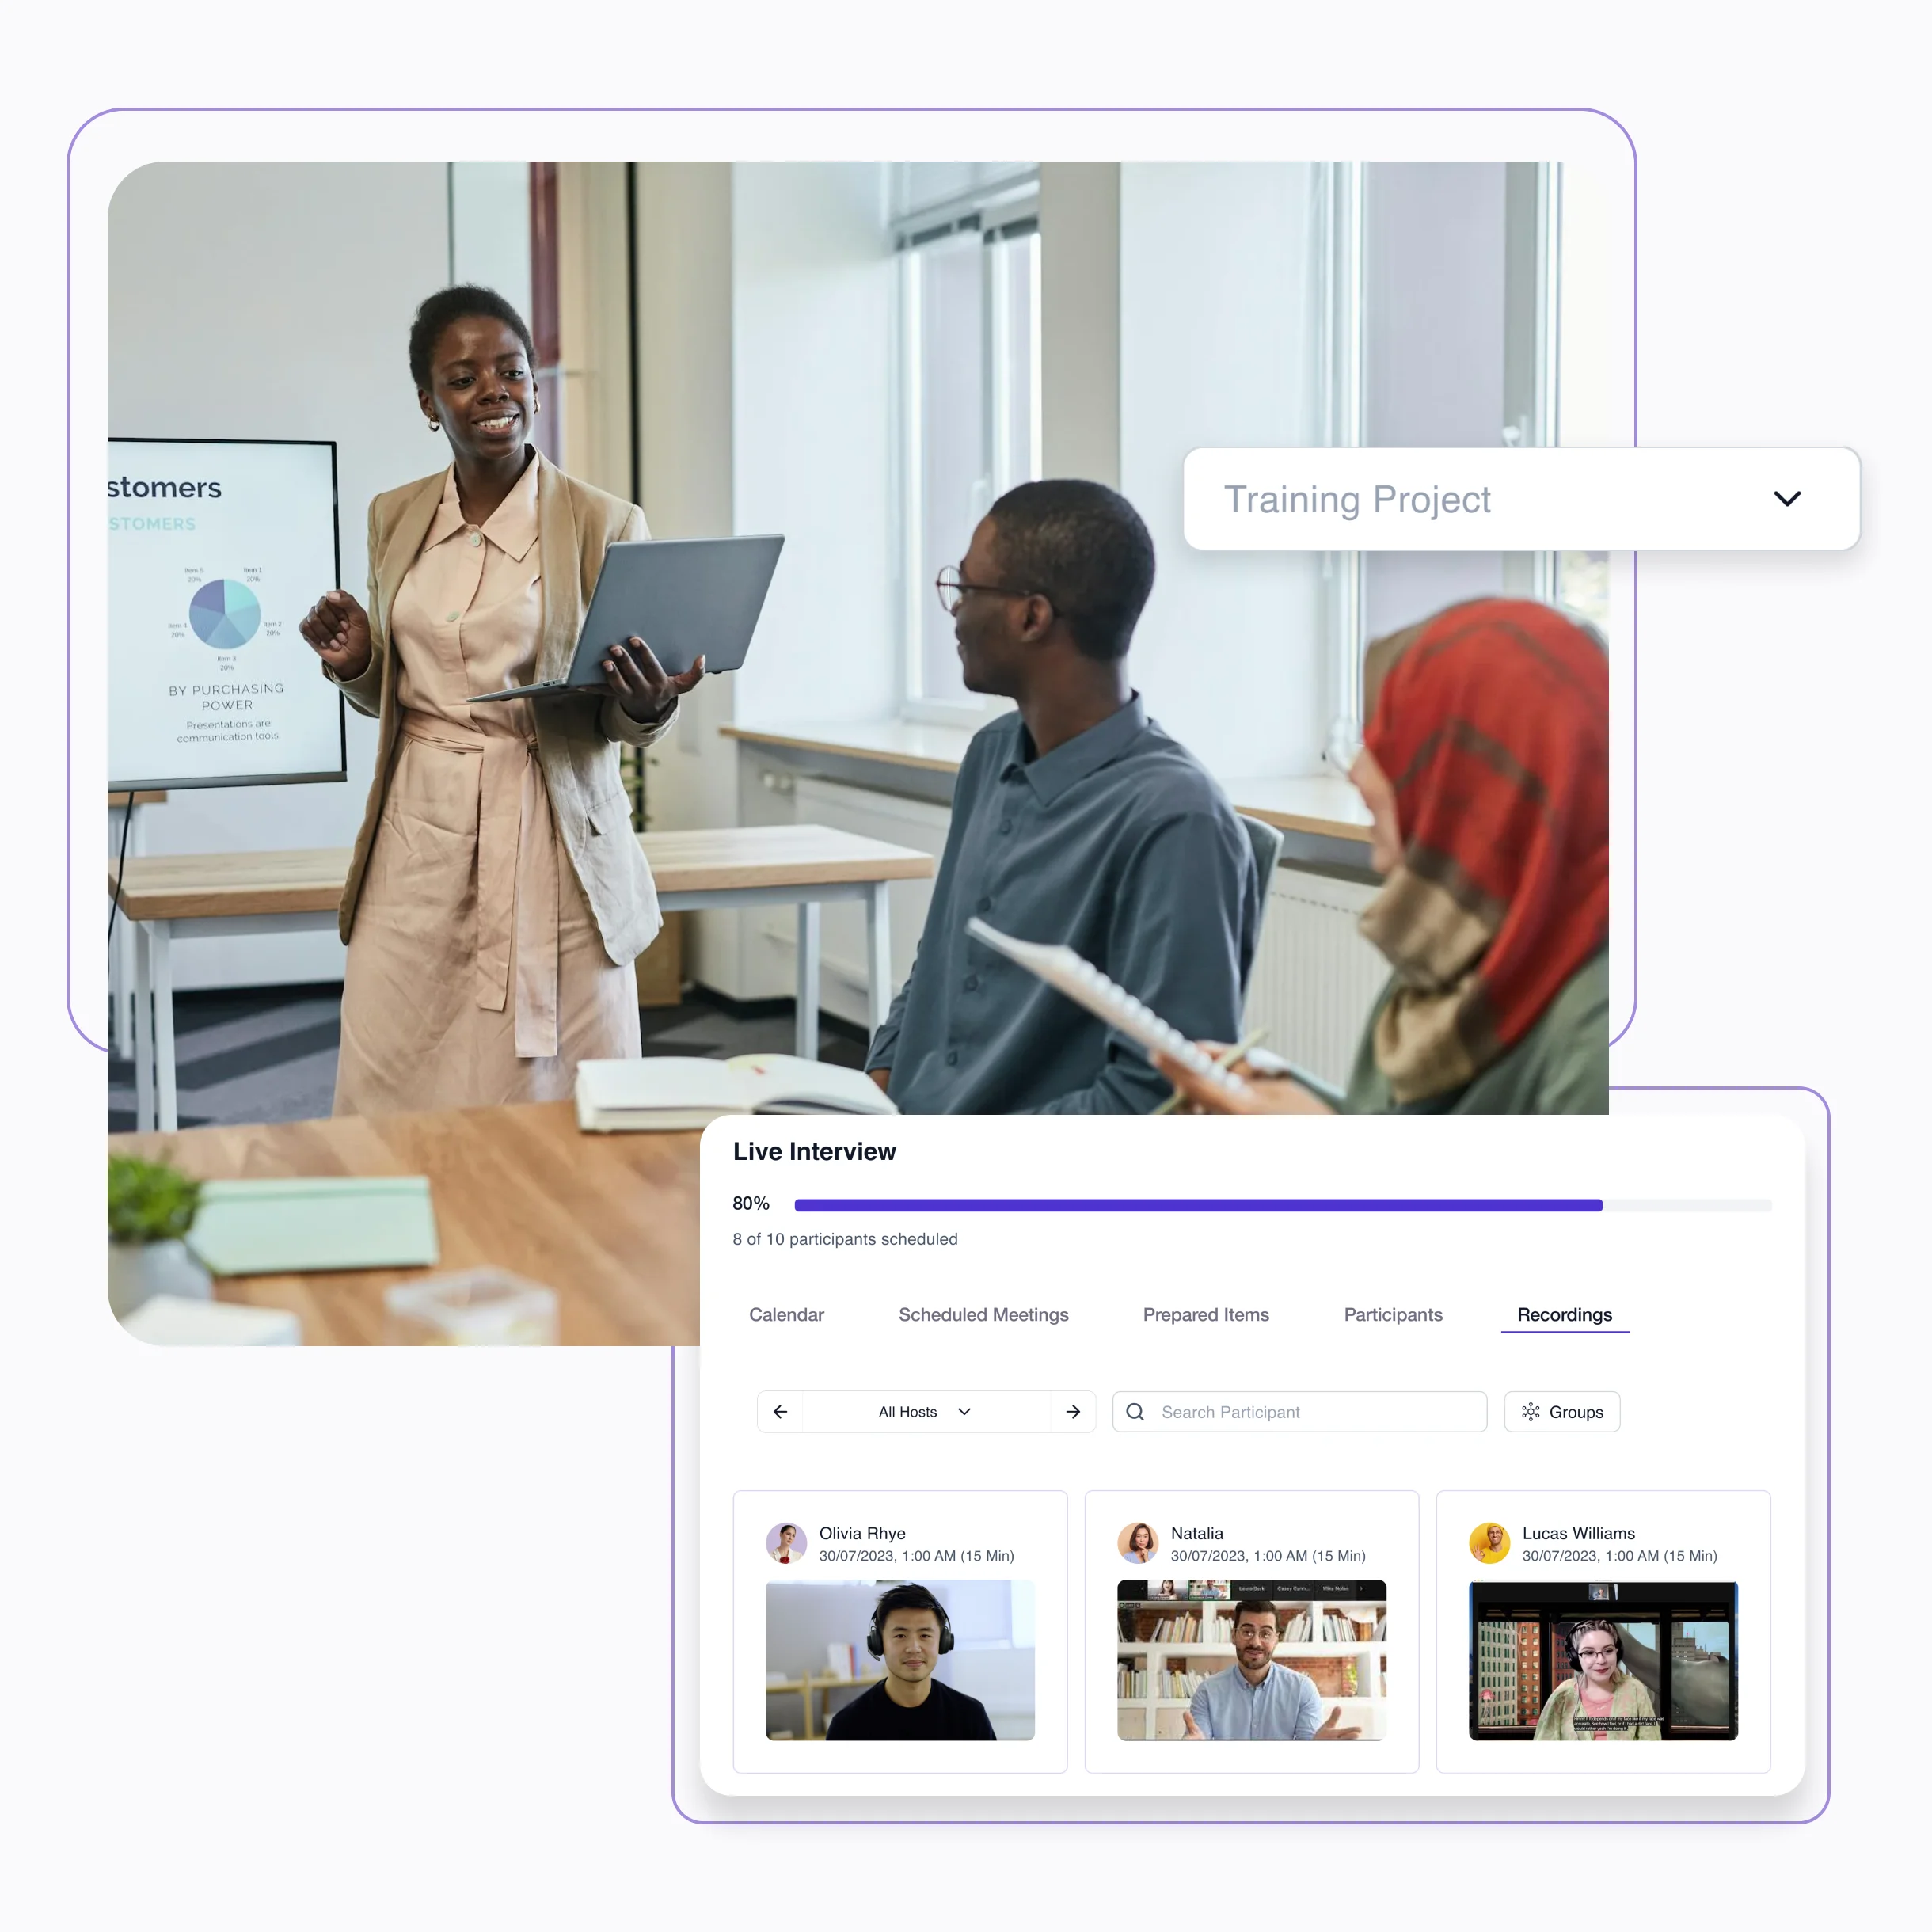
Terapage includes dynamic real-time dashboards that update as data is collected. These dashboards provide a comprehensive overview of study progress, participant engagement, and emerging trends, enabling researchers to monitor their projects continuously. Having instant access to data ensures that researchers can respond quickly to unexpected findings or refine their study design as needed.
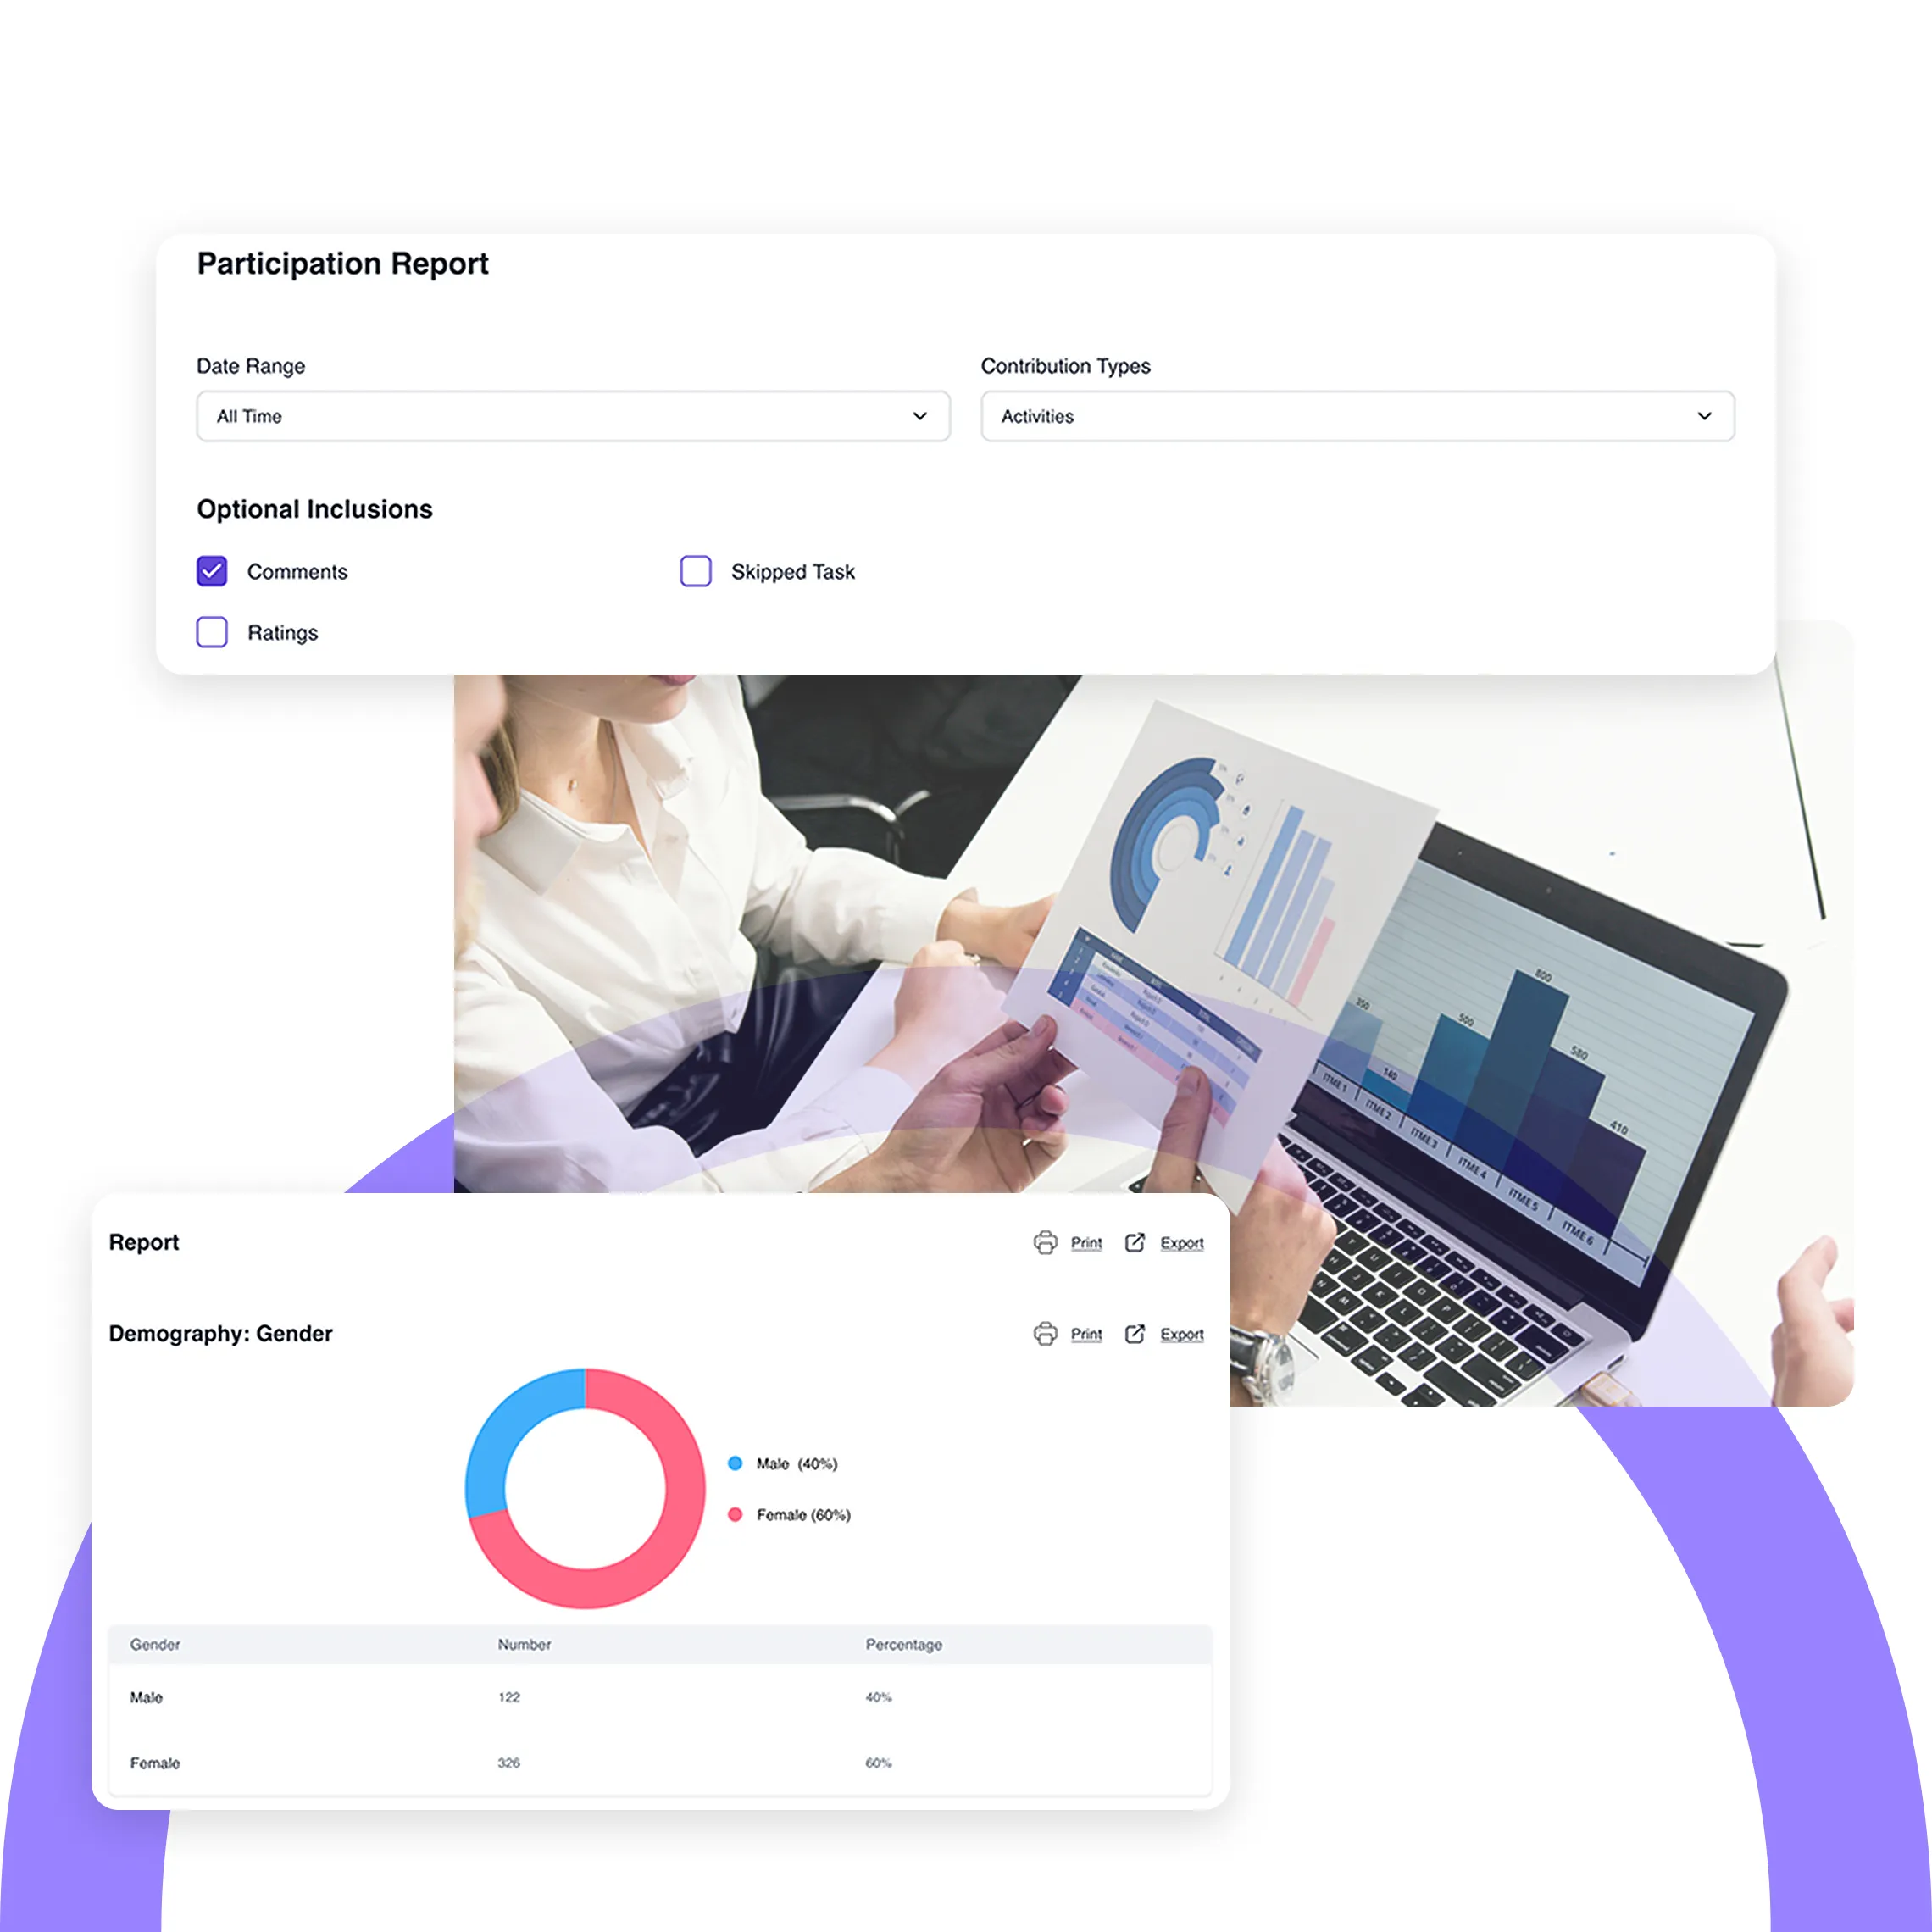
See Use CasesSegmented Data Analysis for Deeper Market Understanding
Understanding the nuances of different participant groups is critical in market research. Terapage enables segmented data analysis, allowing researchers to filter and compare data by demographics, behaviours, or other criteria. This feature provides a granular view of participant responses, helping researchers uncover insights that are specific to particular segments or subgroups.
Integrated Response Streams for Holistic Analysis
The platform’s integrated response streams allow researchers to view all participant inputs across activities in a single, unified view. This holistic approach simplifies the analysis process, making it easy to identify connections and themes across various activities and tasks. Researchers can navigate through responses seamlessly, ensuring no valuable insights are overlooked.
See Use CasesFlexible Data Export Options for Global Collaboration
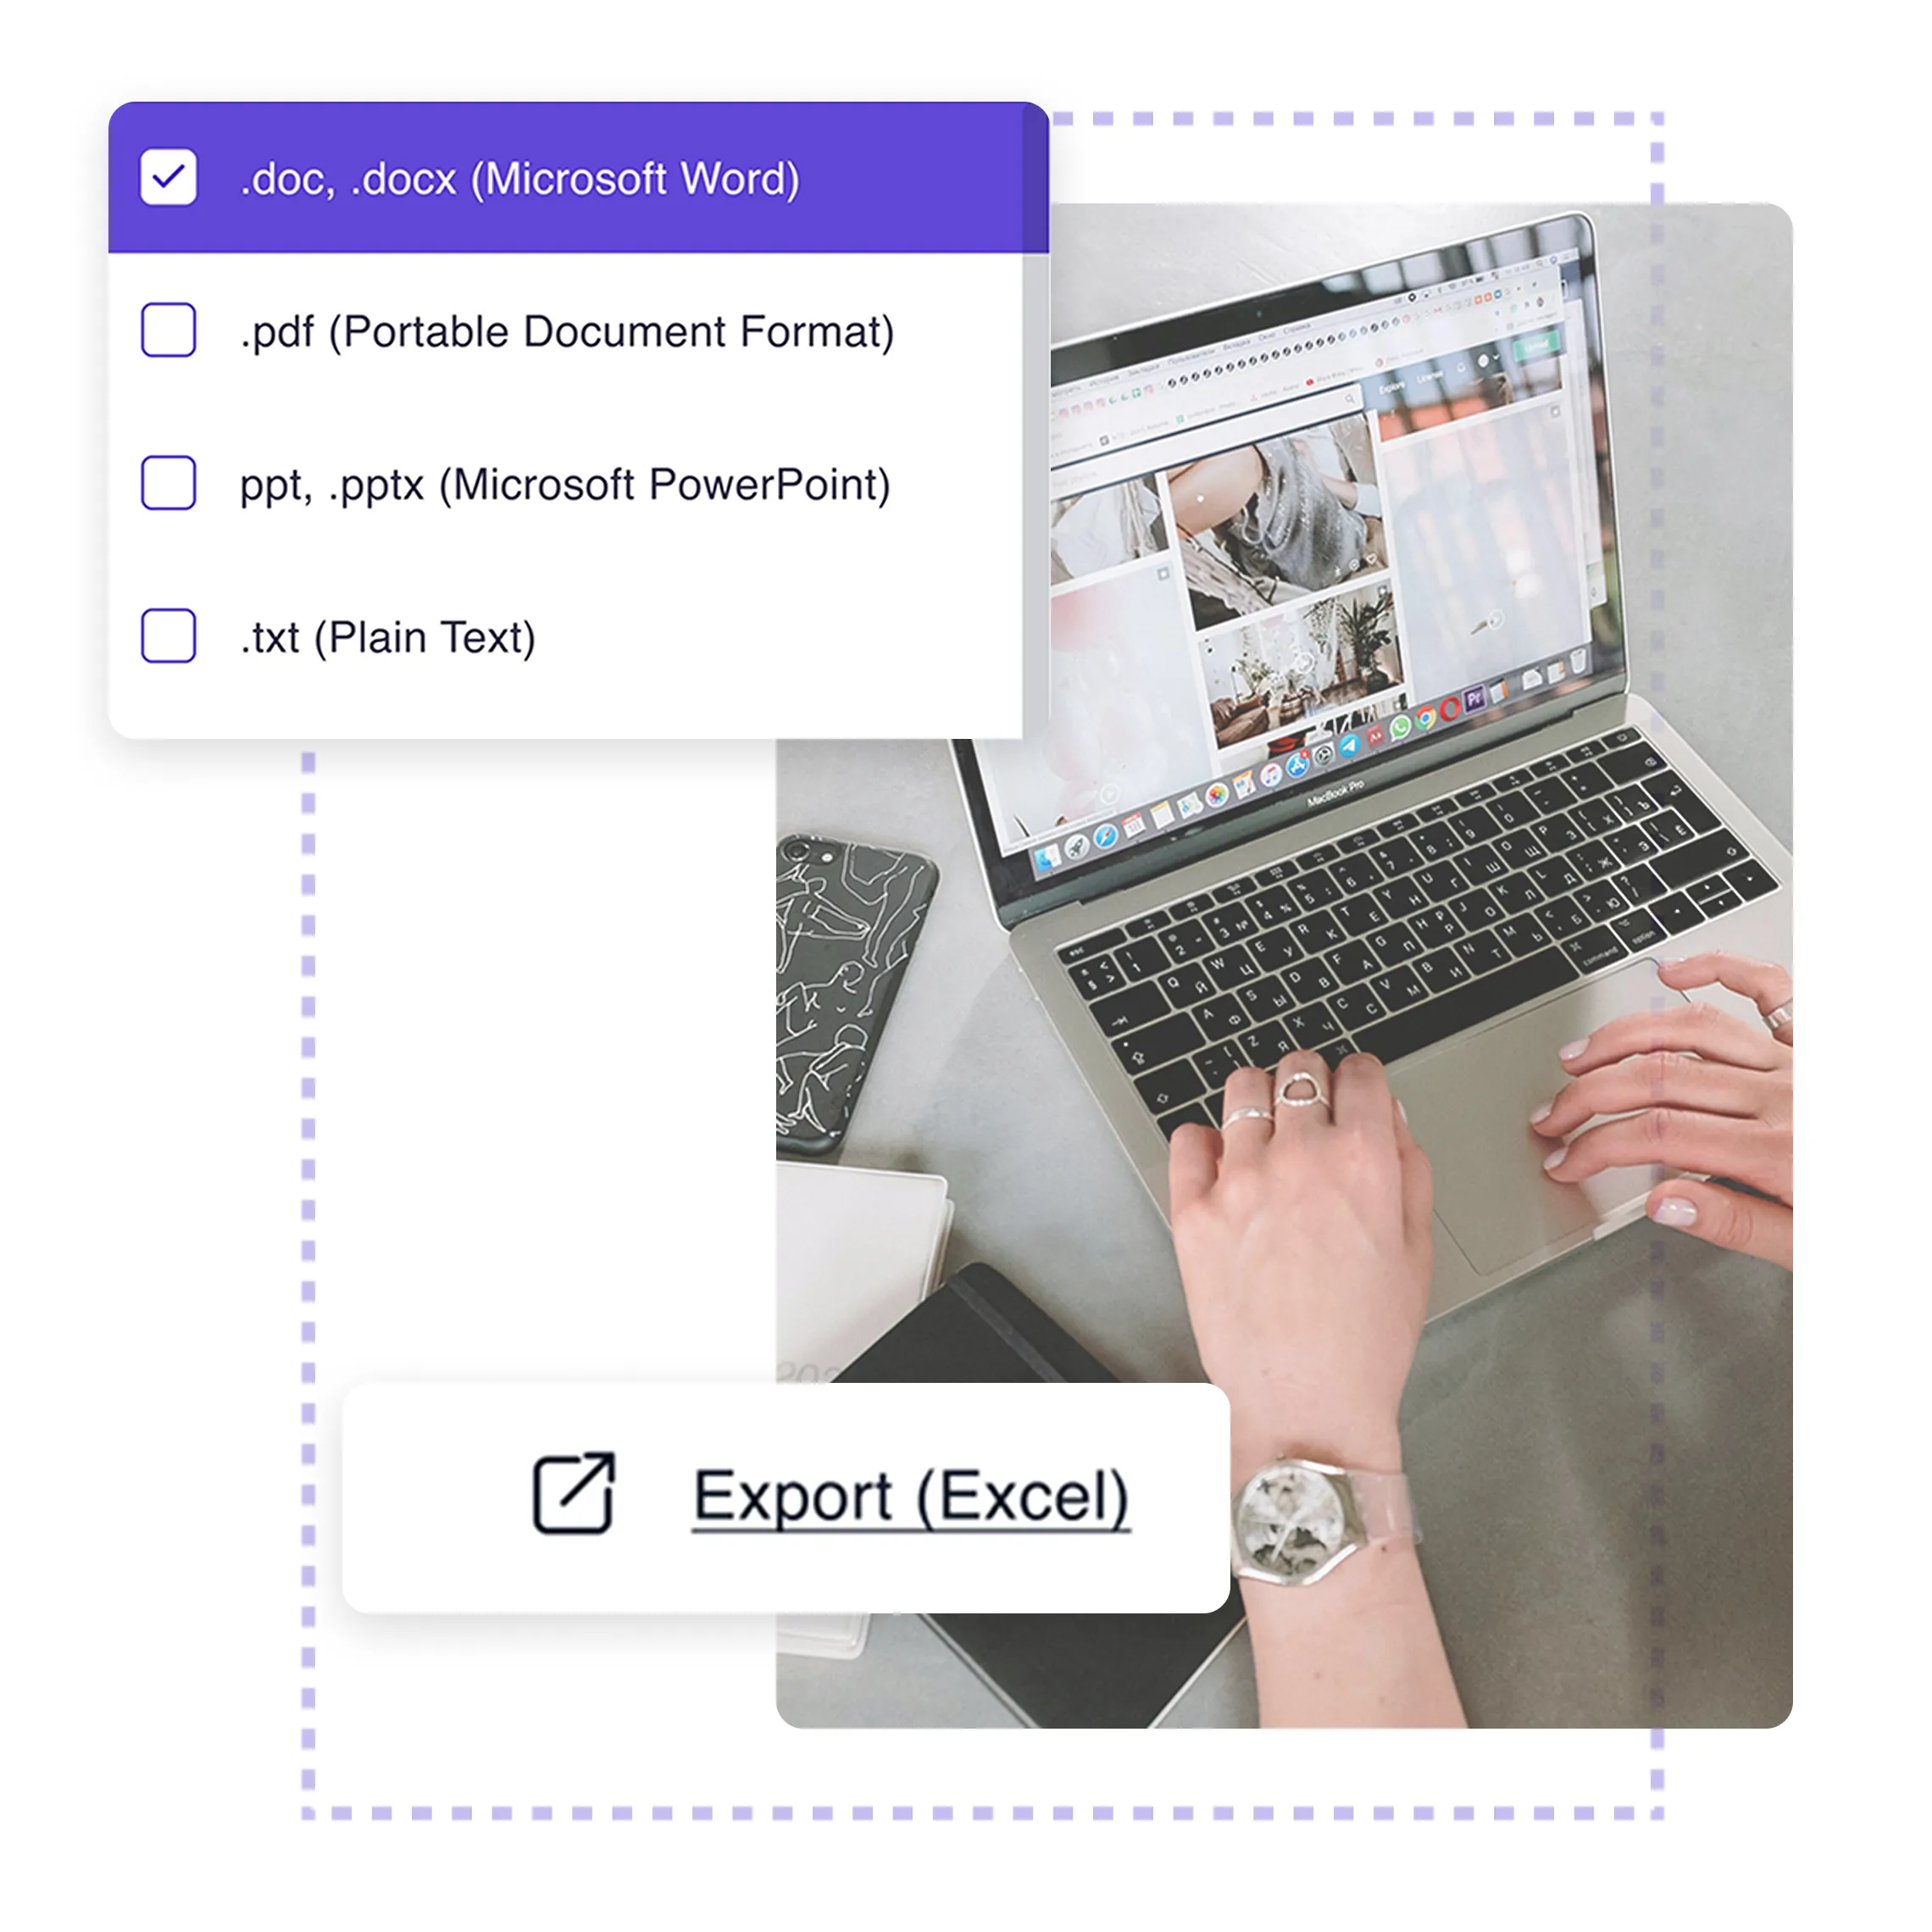
Terapage makes it easy to share findings with stakeholders through flexible export options. Reports and visualisations can be exported in various formats, including PDF, Excel, and PowerPoint, ensuring compatibility with professional presentation tools. Exported reports are professionally formatted and ready to share, streamlining the communication of insights to clients, colleagues, or leadership teams.
Cross-Activity Comparisons for Research Insights
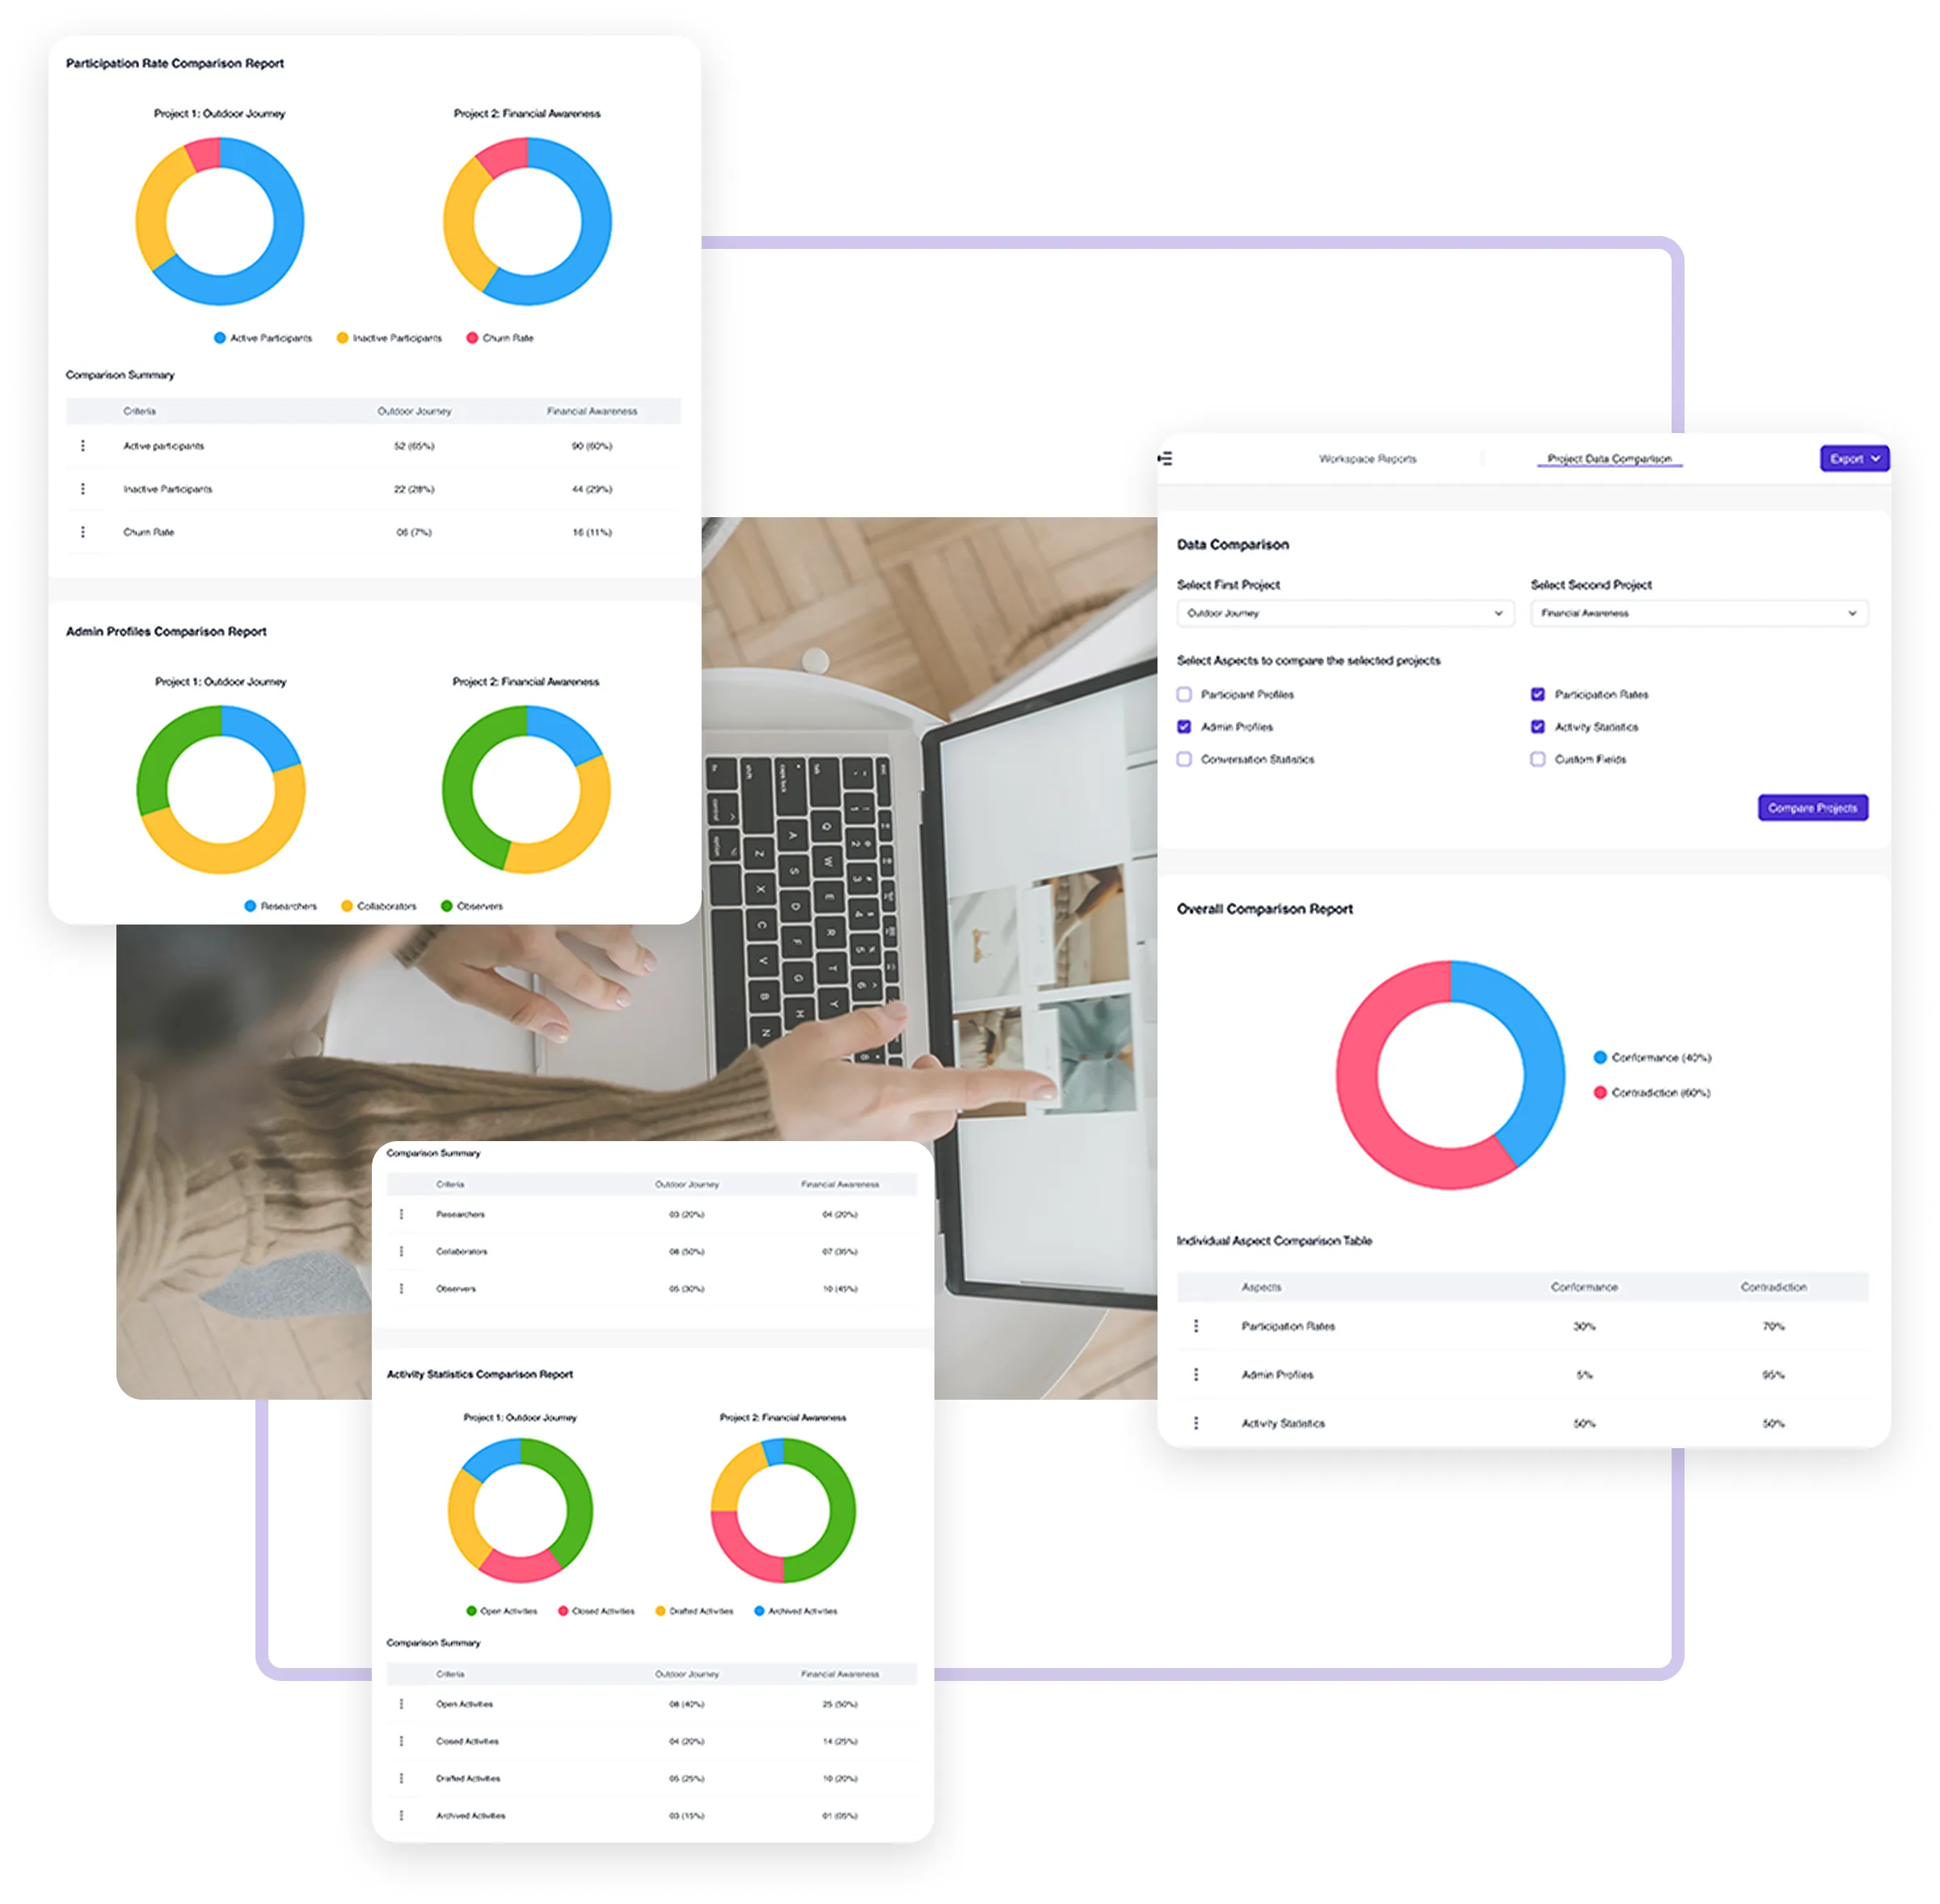
For multi-activity studies, Terapage offers cross-activity comparison tools that allow researchers to analyse trends and patterns across different tasks or time periods. This feature is particularly valuable for longitudinal studies or projects that involve multiple data collection methods, enabling researchers to see the bigger picture and draw more comprehensive conclusions.
See Use CasesInteractive Filtering for Targeted Market Insights
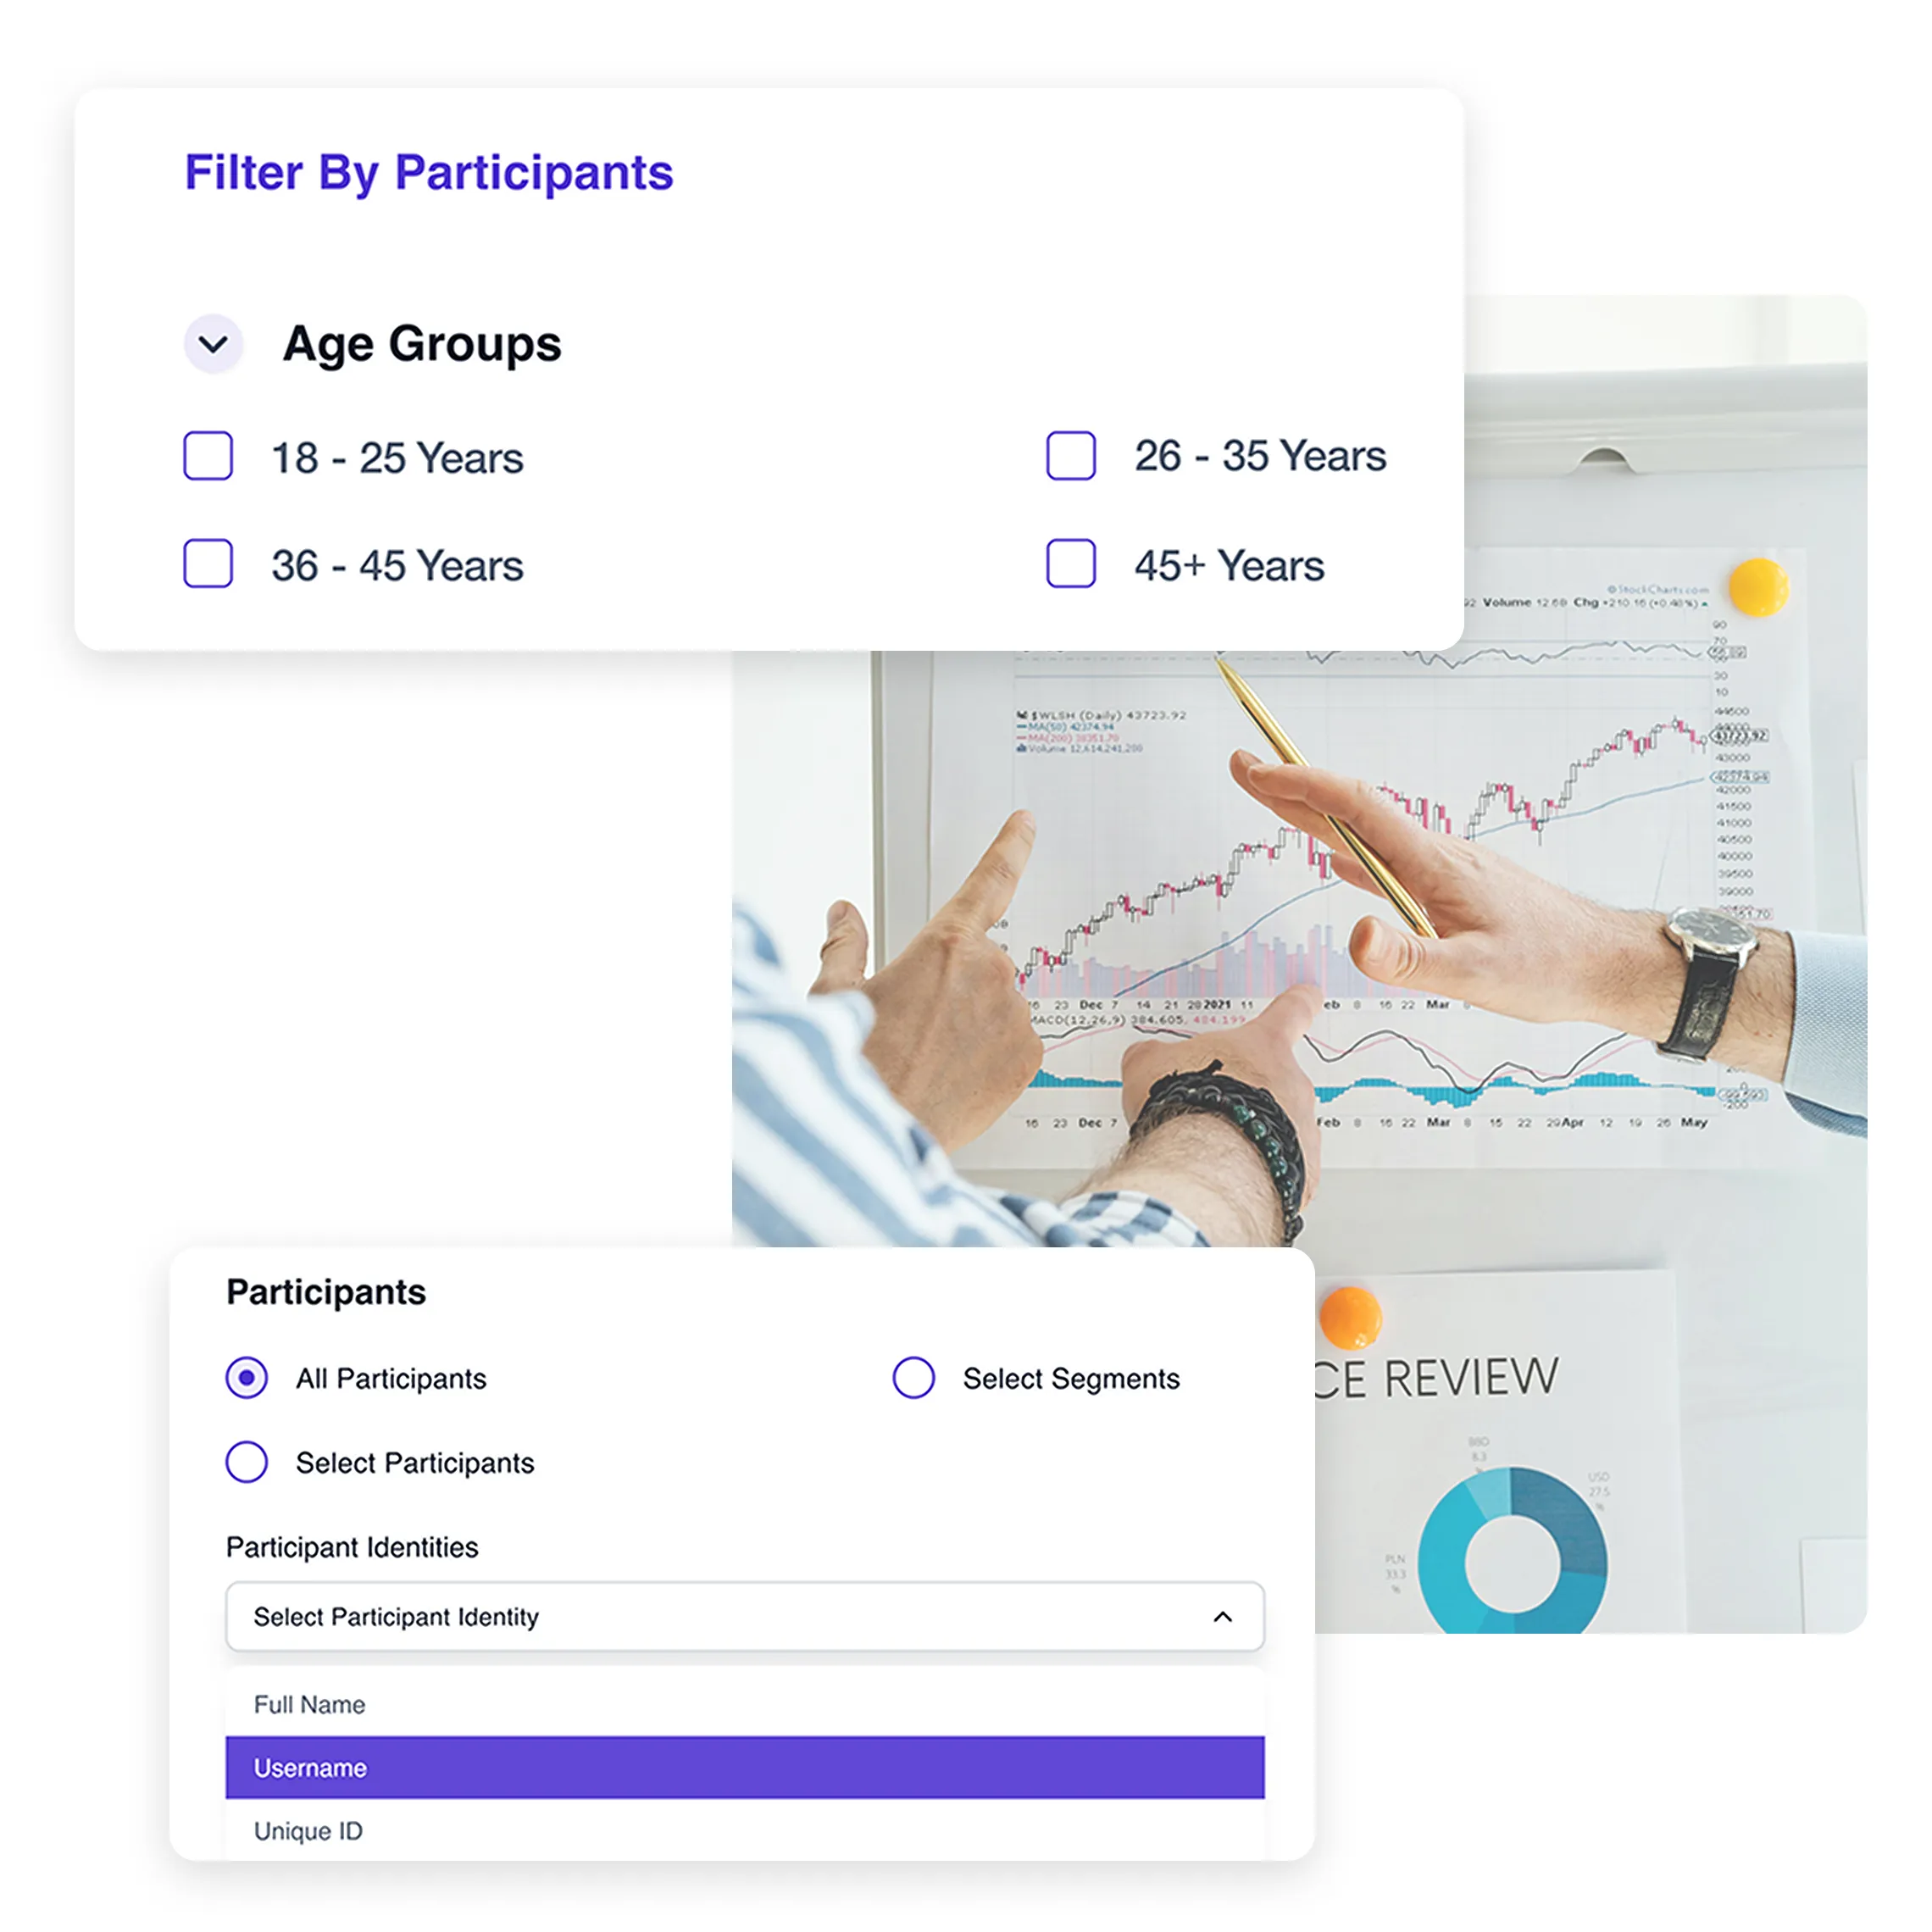
With Terapage, researchers can apply interactive filters to their data, narrowing down responses by specific criteria such as keyword extraction, participant segments, or activity types. This targeted analysis approach allows for a more focused study, helping researchers uncover the insights that matter most to their specific business objectives.
And more platform features & capabilities...


Extra services to ensure that you succeed
We understand that our platform may need to be supported with both the standard and optional packages in order to help you succeed in the research, that is why we offer valuable services that are customised according to the needs of your research.